

Harlequinmania
-
Posts
8,253 -
Joined
-
Last visited
-
Days Won
31
Content Type
Profiles
Forums
Gallery
Everything posted by Harlequinmania
-
 Click through to see the images. In 2007, I purchased a pair of Cirrhliabrus rhomboidalis from Brian Greene of Twilight Aquatics for my 176 gallon reef aquarium. I had kept numerous Fairy Wrasse species before this pair, but I was not prepared for what my new male Rhomboid was to show me. On a night like any other, I was walking past my aquarium on my way to my kitchen to grab a snack, when a bright flash of light caught my peripheral attention from the direction of my reef. I turned to witness the most electric sight ... my male Rhomboid was in full blown courtship ritual! And by electric, I mean electric; Every chromatophore was firing! The wrasse glowed an insanely bright neon yellow and electric blue, darting rapidly back and forth and up and down. The next night, I grabbed my camera hoping to catch a repeat performance, and my wrasse did not disappoint. It's impossible to put into words, and photos only do the display partial justice. This is my male C.rhomboidalis in his normal state ... already quite the show-stopper. Here he is, at the onset of the nuptial display. Note the collapsed fins and intensified pigmentation. And the pigmentation only became more intense as the wrasse assumed an even more distinct arrow shape. As amazing as the wrasse looks here, the photo does not capture the luminescence of the display. With this photo, you can understand what I mean by electric. The Rhomboid is simply bioluminescent ... especially its dorsal fin. My Cirrhilabrus rhomboidalis performed this ritual on a nightly basis for several months. It stopped only when the other male wrasse cohabiting the tank became the dominant specimen of my aquarium. Which wrasse supplanted my Rhomboid, you ask? The even rarer and more incredible Cirrhilabrus earlei (also from Brian Greene)! Photos of my C.earlei pair- including one of my male Earlei wrasse in full nuptial display (I believe the only such documentation in existence) - will be featured in an upcoming Advanced Aquarist Blog. P.S. Mr. Greene: Saltwater fish enthusiasts need you back, pronto! View the full article
 -
Click through to see the images. Doors to the exhibition hall open at 9am with the first speaker at 10am. CTARS is Proud to host the following featured speakers: Ron Shimek Murray Camp Marc Levensonhttp://www.ctars.org/default.aspx?uc=conference2011 Conference only $15 Conference and lunch with the speakers $35 5 Tickets @ $5 11 Tickets @ $10 17 Tickets @ $15 25 Tickets @ $20 On line ticket sales will continue until 5/7/2011. Ticket prices after 4/1/2011: [*]Conference only $25[*]Conference and lunch with the speakers $45 Check out the website for more information. View the full article
-
NOAA's Fisheries Service has announced it is implementing the regulatory recommendations of the International Pacific Halibut Commission (IPHC) due to concerns over declining halibut stocks. These regulations include limiting the maximum size of a halibut caught by charter anglers in southeastern Alaska to 37 inches, and retaining the one-fish-per-person-per-day rule that began in 2009. The halibut stock is declining due to reduced numbers of fish reaching a catchable size range, lower growth rates, and higher than target harvest rates. The stock remains at risk of further declines. Conservation of the halibut resource is the primary concern and management objective of the measures. View the full article
-
Click through to see the images. Why write for Advanced Aquarist Blogs? Become an integral part of the first, longest running, and most revered online aquarist publication. Share your ideas with an established worldwide audience. Contribute to our hobby's collective knowledge. Post according to your personal schedule. There are no deadlines to meet, no assignments to follow, and no strict commitments. Submit blogs at your own pace. And yes, there are perks! Email us for more details. We are especially interested the following types of contribution: Aquarium product news and reviews Aquarium industry news Reports from conventions and frag swaps. Information about rare and collectible aquarium specimens New or popular reefkeeping trends and topics DIY enthusiasts If you would like to join Advanced Aquarist's blog team, please contact us for more information. View the full article
-
Click through to see the images. ADMISSION The cost for TBRC members: FREE The cost for other club’s members $3 The cost for no affiliation $5 The cost for kids 12 and under FREE We will have free coffee and doughnuts for breakfast! For a small fee we will have lunch to make sure nobody goes hungry. Hopefully Beth from Seahorse Corral with her beautiful seahorses, Frank from Eco Aquatics with food for our corals and fish, and Dave and Amanda from Next Reef will be there. We will also have a 50/50 draw that Justin will be in charge of and a raffle that I hope will be bigger and better than last year! You need not be present to win just make sure you have your name and phone number on the ticket. We will probably start drawing tickets around 4:00. Russ and Jose will be out there collecting membership dues! Come on out and sign up with the best club around! The Tampa Bay Reef Club. Come on out and join us. We are sure to have a lot of fun. There is a playground there where the kids can play while you shop for frags. We hope to see everybody there! View the full article
-
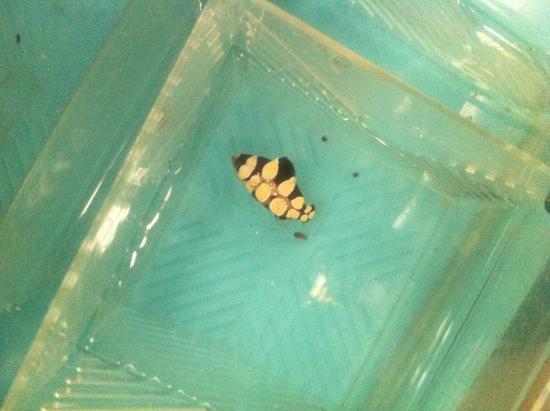
This is really nice !

-
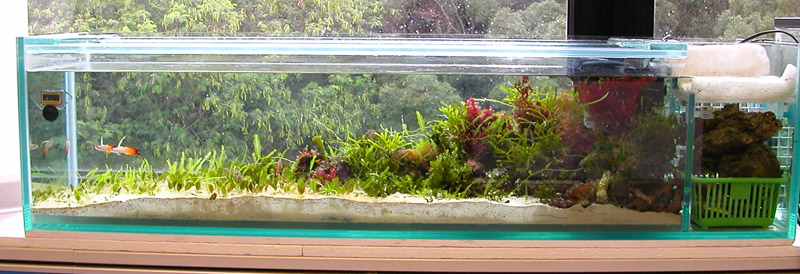
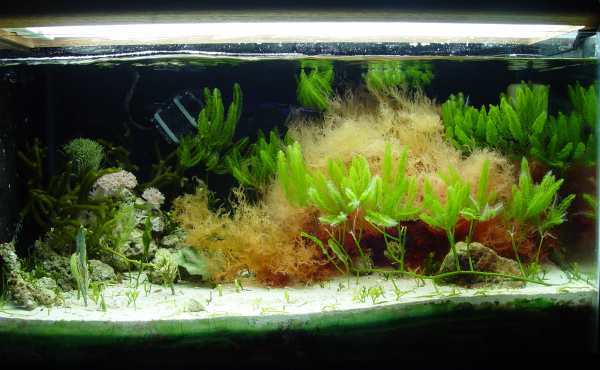
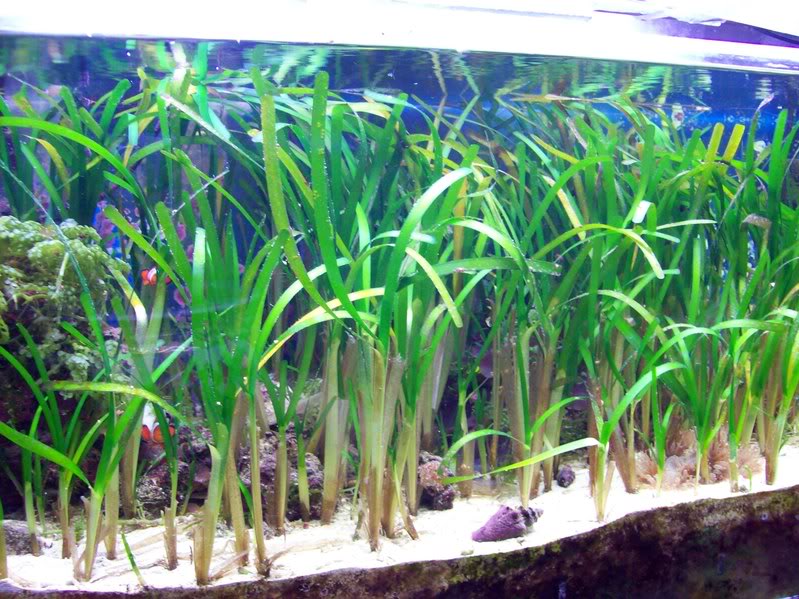
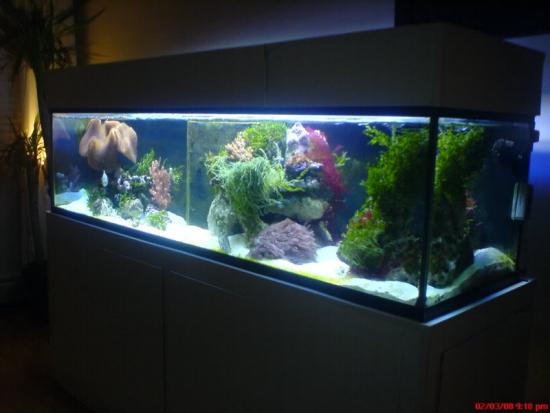
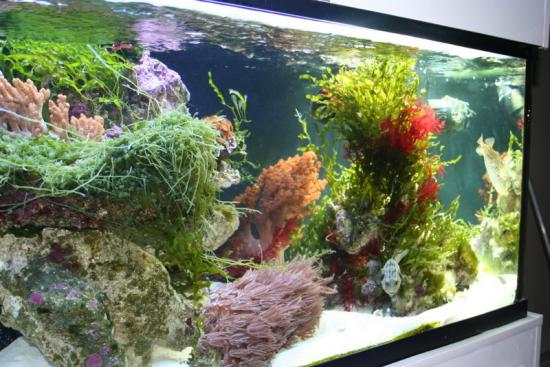
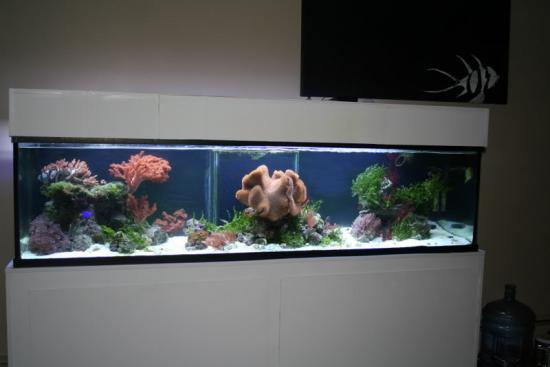
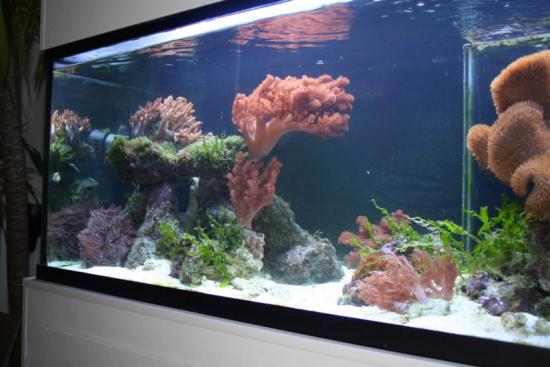
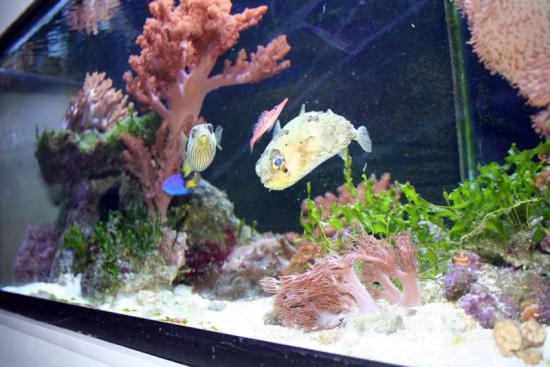
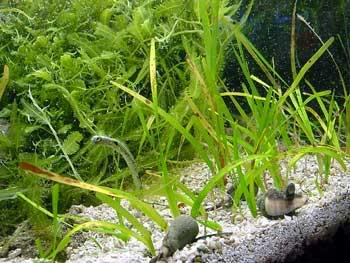
more


-
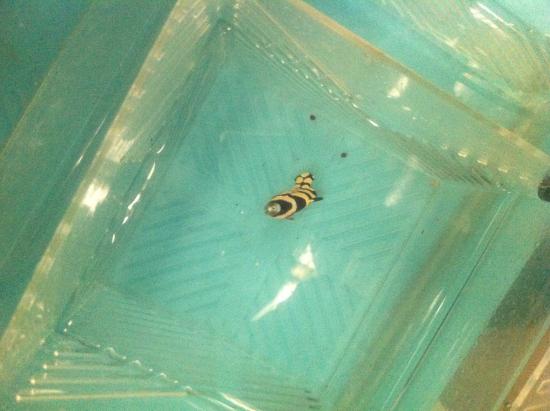
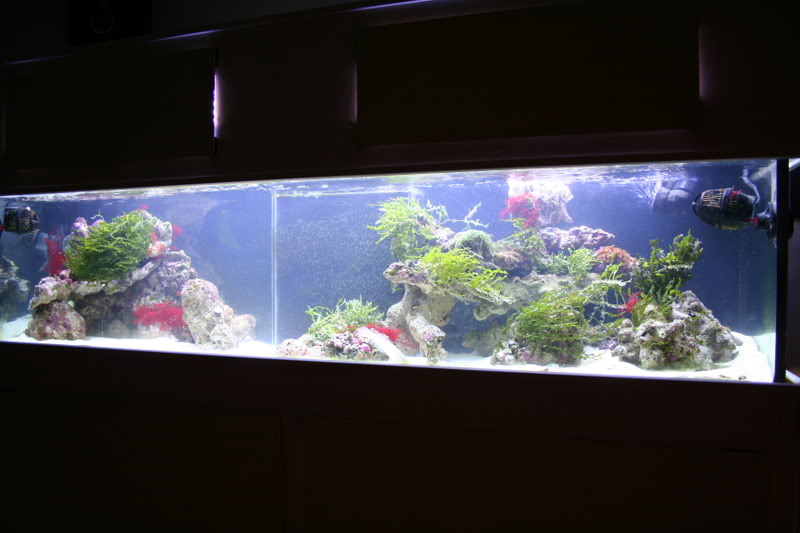
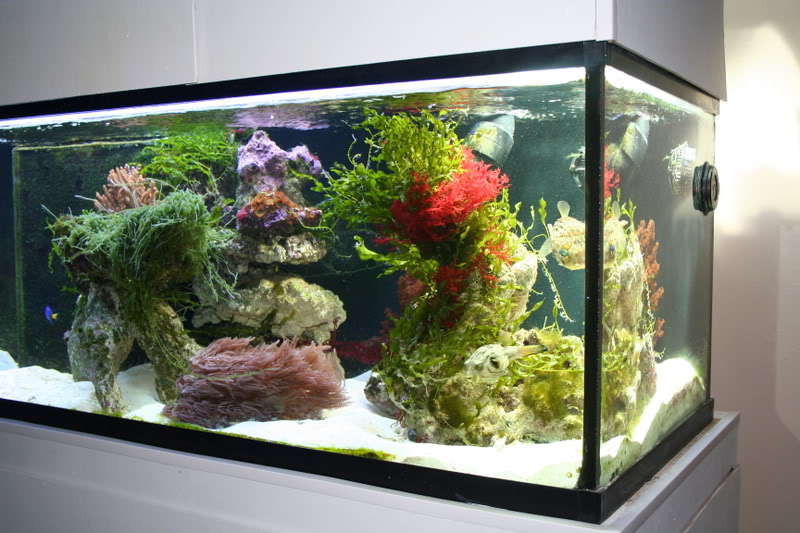
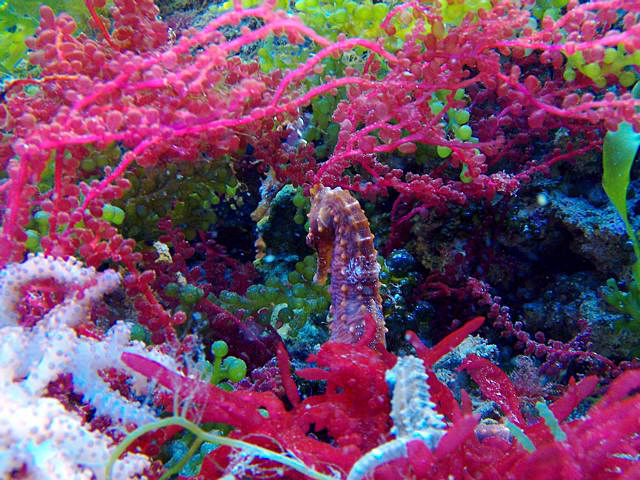
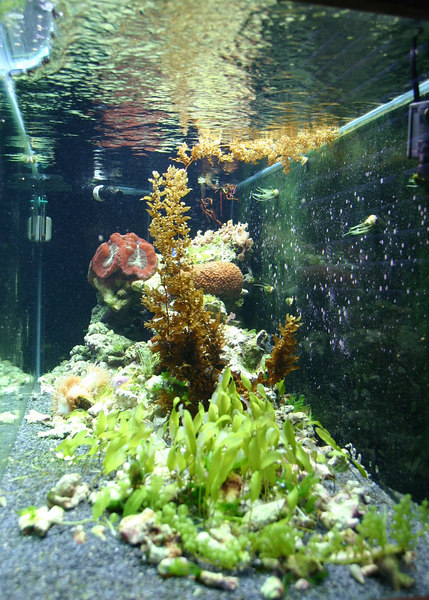
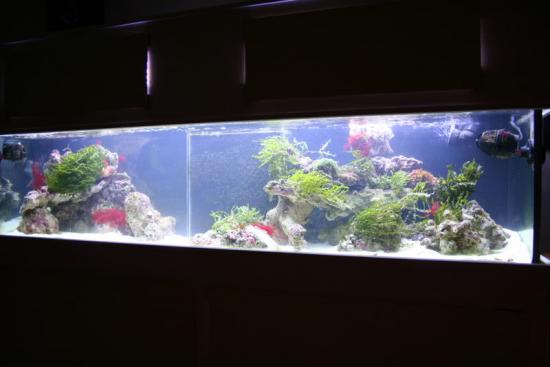
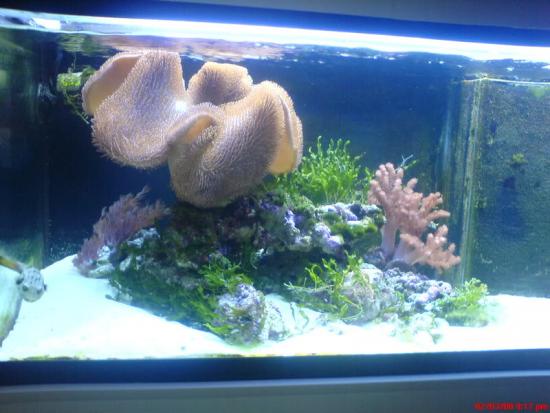
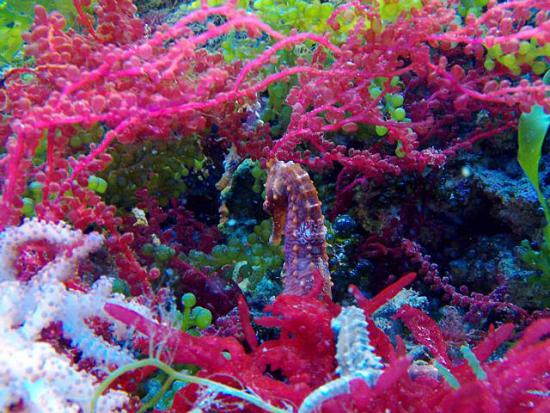
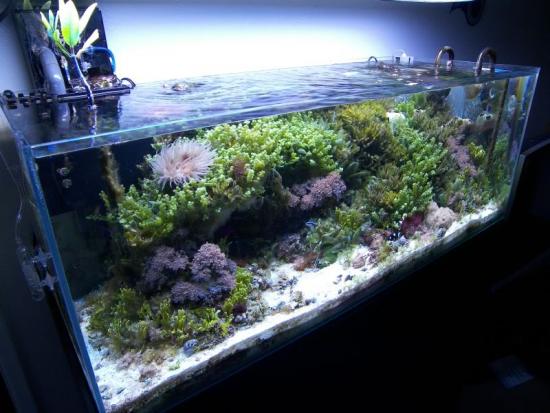
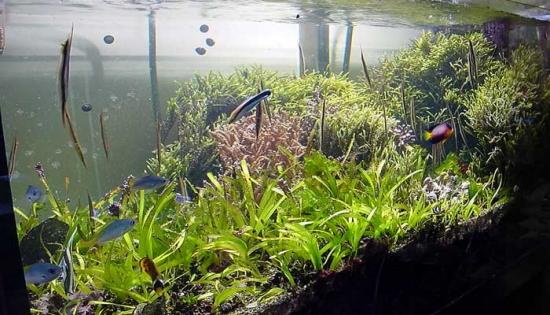
More photos to share.


-
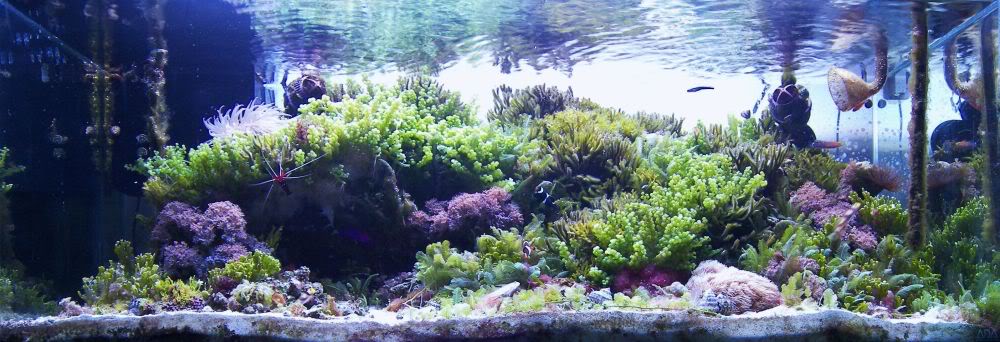
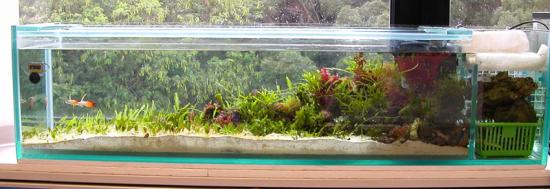
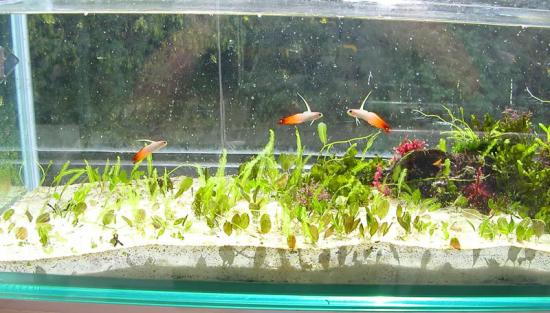
More marine planted tank shot.


-
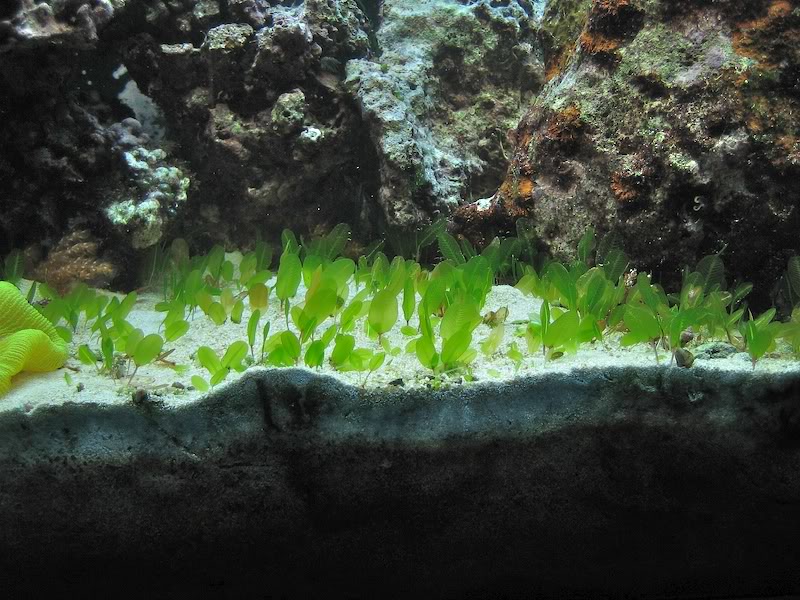
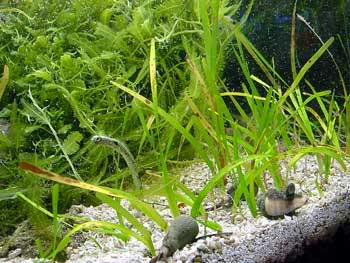
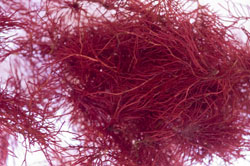
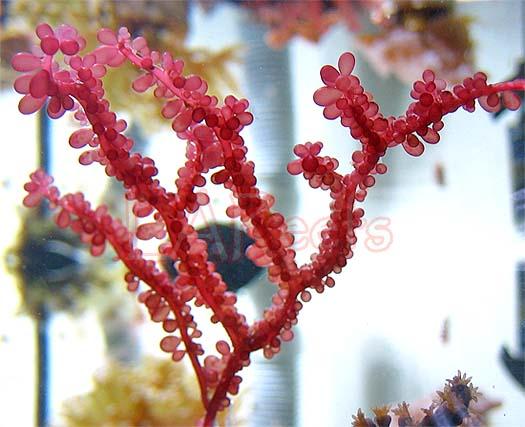
Ogo Alage (Gracilaria parvisipora )
-
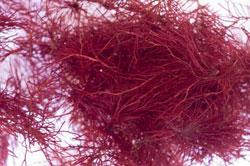
Red Grape Algae ( Botryocledia spp. ) Red Grape Algae is similar in appearance to Green Grape Algae, but they are not at all related. Red Grape Algae will grow quickly under excessive flow and higher lighting than most green algae. It is a favorite food for tangs and other herbivores. Best kept in a refugium, this plant does not tolerate inferior water conditions and prefers water that is lower in nutrients. This plant may sometimes comes attached to a small piece of rock which can be easily placed in a refugium. Otherwise, placing plant base into sand and weighting down with a rock usually encourages it to take root.Though you can use an iron supplement in the absence of nutrient rich water, moderation and care should be taken when using this supplement as iron can also encourage the growth of nuisance hair algae and less desirable macroalgae.
-
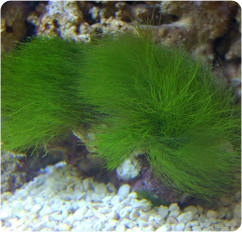
Madien's Hair ( Chlorodesmis fastigiata ) Madien's Hair algae provides a very soft appearance combined with all of the other benefits of macroalgae. Maiden's Hair looks like a thick mat of bright green carpet, adding an intense green color and soft flowing motion to any marine aquarium. Most Maiden's Hair is collected off of the islands of Tonga or Fiji, and comes already attached to a small piece of live rock. There are several different species of macroalgae available to the marine hobbyist. The benefits of macroalgae cannot be understated, so if you have a marine setup, be sure to include a few of these special plants and your fish will reap the rewards.

-
Ongoing climate-driven changes to the Arctic sea-ice could have a significant impact on the blooming of tiny planktonic plants (phytoplankton) with important implications for the Arctic ecosystem, according to new research, View the full article
-
Ongoing climate-driven changes to the Arctic sea-ice could have a significant impact on the blooming of tiny planktonic plants (phytoplankton) with important implications for the Arctic ecosystem, according to new research, View the full article
-
Sure.. Good thing must share lol
-
Researchers have identified a small virus that attacks another virus more than 100 times its own size, rescuing the infected zooplankton from certain death. The discovery provides clues to the evolutionary origin of some jumping genes found in other organisms. View the full article
-
A new study of 45-million-year-old pollen from Pine Island west of Fort Myers has led to a new understanding of the state's geologic history, showing Florida could be 10 million to 15 million years older than previously believed. View the full article
-
Click through to see the images. Departments of Chemistry (Ken S. Feldman, Allison A. Place) and Industrial and Manufacturing Engineering (Sanjay Joshi), The Pennsylvania State University, University Park, Pennsylvania 16802, and Route 66 Marine, Gardena, California (Gary White) 1. Introduction Bacteria are ubiquitous in the marine environment and they play absolutely decisive roles in every conceivable ecological niche. Numerous studies have documented the impact of bacterial action on life processes and energy transduction in natural reefs, as detailed below. However, a corresponding influx of information about bacteria biology in our captive marine aquaria has been lacking. For example, the inextricable connection between Total Organic Carbon (TOC) in the natural marine environment and one it its major consumers, bacterioplankton, constitutes the most fundamental level of the marine food web (Johannes, 1967; Ducklow, 1979; Eppley, 1980; Ducklow, 1983; Gottfried, 1983; Moriarity, 1985). Thus, bacterial grazing on this carbon-rich food source is an absolutely obligatory first step in the incorporation of this central nutrient into the food chain. In addition to a carbon source, bacteria require nitrogen and phosphorus compounds in significant quantities along with trace amounts of many other elements, perhaps the most critical of which is iron. Deficiencies of any of these macro- or micronutrients can, in principle, serve as a limiter of growth (details below). On the other hand, much less is known about bacterial nutrient needs in the captive environment of a reef aquarium, and in fact there have not been any studies that document bacterial growth responses to any specific nutrient in a reef tank. Nevertheless, one of the more recent aquarium nutrient export methodologies is based upon the hypothesis that bacteria growth in reef aquaria is carbon limited. This methodology has been dubbed "Carbon Dosing" (Walton, 2008; Michael, 2008), and it has three basic premises: Bacterial growth in reef aquaria is carbon source limited. Adding a digestible carbon source therefore will spur bacteria population growth, and with that growth, other necessary nutrients, like nitrogen- and phosphorus-containing compounds, will be scavenged from the water column. Mechanical filtration via protein skimming (and possibly Granular Activated Carbon (GAC)) will remove bacteria from the aquarium water column, and with them their C/N/P nutrient load. Thus, according to this approach, the export of undesired nutrients (nitrogen and phosphorus compounds) will be achieved upon carbon dosing. Much variation in carbon sources, including vodka (EtOH), sucrose (table sugar), vinegar (acetic acid), and solid biopellets (biodegradable polyesters), have been promoted. In addition, media that are alleged to facilitate bacterial biofilm formation, like Zeolites, have been incorporated into this emerging technology. Of course, bacteria export by skimming requires that the bacteria actually reside in the water column and not as a film on a solid support, and so mechanical mechanisms to dislodge the biofilms from these media have been engineered into the process, such as agitation of the (Zeolitic) media on a frequent basis. Finally, several commercial proponents of this methodology offer pre-packaged bacterial mixes and bacteria foods as starter kits. However, despite the proselytizing of its advocates, this approach to nutrient export rests entirely on the untested hypotheses that are listed above. Does it really work as advertised? Our earlier research on the topic of carbon nutrient levels in marine aquaria (Feldman, 2008; Feldman, 2009; Feldman, 2010) has provided experimental documentation for four conclusions that impact on TOC management in our reef tanks: Reef aquaria utilizing active filtration (GAC, skimming) maintain equilibrium TOC levels within the range found on healthy tropical reefs. Protein skimming (i.e., bubbles) is not very effective at removing TOC from aquarium water, depleting typical reef tank water of only ~ 20 - 35% of the post-feeding TOC present. GAC filtration is quite effective at stripping reef tank water of its TOC load, removing 60 - 85% of the TOC present. And, quite intriguingly, the natural biological filtration, which starts with bacteria and other microbes, is remarkable in its capacity to remediate reef tank water of TOC, easily removing 50% or more of the post-feeding TOC increase in tank water. Conclusions (2) and (3) describe the consequences of mechanical filtration on TOC levels, but the 4th conclusion emphasizes the importance of the "hidden" part of the remediation equation, bacterial predation, for gaining an understanding of the dynamics of carbon commerce in our aquaria. In fact, this observation, coupled with the advent of Carbon Dosing strategies for nutrient export, led to a new series of questions regarding the perhaps pivotal role of bacteria, or at least skimmable water column bacteria, in successful reef aquarium husbandry. 1.1 The goal of our study - testing the validity of the Carbon Dosing hypothesis With this information as preamble, we set out to explore the following questions: What are the bacteria populations in the water column of reef tanks, and how does that value compare with bacterial counts in authentic reef water? Does carbon dosing indeed increase water column bacteria populations (i.e., is growth carbon limited)? Does mechanical filtration (protein skimming and/or GAC filtration) actually remove bacteria from the water column, and if so, how much? 1.2 Bacteria: A general introduction Bacteria are found everywhere on the Earth's surface where water is at least temporarily available. Their ubiquity, along with their sheer numbers and fast growth rates, means that they are extremely important geochemical agents. By facilitating aqueous oxidation-reduction processes, concentrating metal cations and anions, creating stored chemical energy, decomposing organic material, and mediating mineral precipitation and dissolution, they drive the Earth's biogeochemical cycles. Similarly, bacteria are essential agents for the biogeochemical processes that take place in marine aquaria. These biogeochemical processes include decomposition of organic matter, nitrification, denitrification, nutrient and element assimilation, sequestration and release ("cycling"), and chelation and the formation of complexes with a wide variety of ions and compounds. As recently as the mid-1960's, the scientific community was not entirely convinced that "marine bacteria" existed as a distinct group. It turned out that marine bacteria have special requirements for inorganic ions to supply their needs for growth and metabolism, as well as for maintaining the integrity of their cells. They have a highly specific need for sodium, a need for higher concentrations of potassium, calcium and magnesium than are typically available in either freshwater or terrestrial environments, and exhibit a tolerance to halide ions that many other groups of bacteria lack. Many strains of marine bacteria have a preference for amino acids as sources of carbon, nitrogen, and energy, and require vitamins and other growth factors (MacLeod 1965). It is because of differences in cell wall composition, ionic requirements, and tolerances of inorganic ions that the majority of bacteria associated with freshwater aquaria cannot survive a direct transition to marine aquaria. Bacterial Physiology Bacteria are the most physiologically diverse group of organisms in a marine aquarium. They are unicellular (they do not differentiate into multicellular forms) prokaryotic (they have no nuclear membrane, and their DNA is not organized into chromosomes) and they reproduce by cell division. A typical bacterial cell is about 1 micrometer (uM) in diameter or width, compared with most eukaryotic cells that vary from 10 to 100 uM in diameter. Bacteria demonstrate three general shapes: rods ("bacilli"), spheres ("cocci"), and helical shapes ("spirilla" or "vibrio"). When individual cells grow end on end, they form what are known as filaments. They have five characteristic structural components: Unbound DNA ("nucleoid"), ribosomes (protein-making "factories"), a plasma membrane, a cell wall, and a surface layer which may or may not be an inherent part of the cell wall. These structures are arranged into three architectural regions: (1) a cytoplasmic region that is typically over 70% water and near pH neutrality. This region contains the cell's genetic material, ribosomes, gas vacuoles that confer buoyancy to the cell, and various "inclusions" and granules that serve as specific storage sites. The soluble portion ("cytosol") contains a variety of small organic molecules and dissolved inorganic ions; (2) a rigidifying cell wall on top of a plasma membrane that provides support for the cell, protection from external physical stresses, and governs the cell's shape ("morphogenesis"). This region also acts as a filter by controlling the passage of dissolved molecules into the cell. The cell wall also may display attached appendages including flagella (filamentous protein structures to generate movement in motile strains), and fimbriae & pilli (hair-like proteins, which exhibit a wide diversity of form and arrangement, involved in the attachment of cells to surfaces, substrates, and other cells); and (3) a surface layer. The three major types of surface layers are extracellular polymers ("capsules"), sheaths, and S-layers. This region's functions include (a) protection from environmental and pH extremes, ( attachment & adherence to surfaces, © stabilizing biofilm communities, (d) storage of carbon and energy reserves, (e) binding of metals, (f) formation of minerals that can serve as chemical buffers at the cell's periphery, (g) alteration of light dispersal patterns, and (h) the masking of the electrochemical charge characteristics of the cell wall, thereby mediating physiochemical reactions between the cell and the ions & solids of the external environment (Konhauser, 2007). Bacterial Surface Charge and Protein Skimming Extending from the cell wall and surface layer regions are organic "functional groups". Functional groups are specific collections of atoms bound together into well-defined structures; these structures typically confer one distinct chemical reactivity pattern to the collection of atoms. Many of these organic functional groups can either bind hydrogen ions ("protonation") or release hydrogen ions ("deprotonation"), depending upon the pH of the bacteria cell's immediate environment. The combined protonation and deprotonation states of the functional groups on the cell wall largely determine the hydrophobic and hydrophilic characteristics of a bacterial cell at any given pH. Functional groups may also act as ligands that can bind with other ions or compounds to form larger molecular complexes. For example, it has been estimated that as much as 99% of the dissolved iron in ocean surface waters is bound to organic ligands (Granger, 1999). Such complexes also may impart a charge to the cell wall, thereby affecting the cell's hydrophobic-hydrophilic characteristics. Functional groups may be specialized to act as chelating agents for the capture and transport of specific ions ("siderophores"). The resultant complex may also affect surface charge. A bacterial cell's surface charge affects its hydrophobic/hydrophilic characteristics and therefore that cell's potential to be removed from solution by foam fractionation ("protein skimming"). Bubble-based removal of particles like bacteria, as well as dissolved organic carbon (DOC), is largely dependent upon the hydrophobic character of the particle/molecule; the more hydrophobic patches, the greater the binding energy to the bubble's surface, and hence the greater likelihood for bubble-based removal (Feldman, 2010, and references cited therein). The addition of inorganic salts to a solution containing bacteria has been demonstrated to increase the rate of removal of bacterial cells from that solution (Gaudin, 1960 & 1962). Magnesium chloride and calcium chloride have been demonstrated to increase the concentration of bacterial cells in the foam generated by protein skimming (Bretz, 1966). Differences between the types of functional groups present on the bacterial cell walls, bacterial cell surface charge, response to ambient pH, and the concentration of inorganic salts all influence the degree to which a bacterial cell is available for export via protein skimming. This influence occurs independently of the physical operating characteristics of a given protein skimmer. 1.3 Bacterial life processes Bacterial Metabolism Bacterial metabolism describes the set of chemical processes that allows bacteria to grow, reproduce, maintain structures, and interact with their environment. The physical and genetic characteristics of bacteria profoundly influence their metabolism. The small size of bacteria allows them to acquire external energy and nutrients at the cell's periphery and to optimize transport processes into/out of the cell. These transport processes include passive & facilitated diffusion, active transport, and engulfing materials with their cell membrane (endocytosis). Bacteria synthesize proteins to regulate every phase of their metabolic behavior. The types of proteins that a bacterium can synthesize are determined by its genetic characteristics. Bacterial Growth Bacterial populations in marine aquaria may complete their life cycles entirely as isolated, or semi-isolated, strains within the system's water column ("free-living"), or attached to surfaces in a colony consisting of multiple strains ("biofilms" or "mats"). Bacteria populations demonstrate a growth cycle with four stages: (1) a "lag" phase, which is the initial period of time within which cells adjust to their new surroundings and synthesize proteins in response to that environment; (2) an "exponential growth" phase during which the population demonstrates a rapid increase in biomass; (3) a "stationary" phase during which there is no net increase or decrease in overall cell number, and groups within the population may be either metabolically active or inactive; (4) a "death" phase during which the number of viable cells decreases. As a population enters death phase, members of the population may compensate by budding and by the formation of protective structures such as exospores, endospores and cysts. Such protective structures have proven to be an extraordinarily successful evolutionary adaptation; for example, Bacillus spores have been resuscitated after preservation in amber for 25 million years (Cano, 1995). Factors characteristic to a bacteria's environment can also regulate bacterial growth patterns. These factors include nutrient availability, temperature, substrate supply, predation, and viral mortality. Bacterial Nutrients Marine bacteria utilize a vast group of elements and compounds to meet their energy and nutrient requirements. Marine bacteria have a special need for sodium. Other major elements required for marine bacteria growth and reproduction include carbon, nitrogen, phosphorous, oxygen, hydrogen, sulfur, potassium, magnesium, calcium, and iron. Common trace element requirements consist of manganese, cobalt, zinc, copper, and molybdenum. Chemical groups fulfilling energy and nutrient needs span an even broader range; inorganic carbon compounds, organic carbon compounds (generally, but not limited to, sugars and amino acids), inorganic & organic nitrogen compounds, organic sulfur compounds, inorganic phosphate compounds, and potassium, magnesium, calcium, and iron salts. Marine bacteria can sequester elements, such as potassium, within their cells at concentrations far in excess of the concentration of the element in their environment (Thompson & MacLeod, 1974). Such sequestration presents the possibility of some degree of elemental depletion in a marine aquarium by bacterial export via protein skimming. Manipulating Bacterial Growth A "limiting nutrient" is a nutrient that has the ability, though its presence or absence, to restrict the utilization of other nutrients. Bacterial growth rates, bacterial carbon production, and bacterial growth efficiency all increase with the addition of organic carbon supplements in certain groups of marine bacteria (Carlson, 1996). The presence of a readily assimilated carbon source has been demonstrated to increase the uptake of ammonium in certain groups of marine bacteria (Goldman, 2000). The availability of a particular nutrient can not only affect a bacterial population's growth rate, but also the metabolic functioning of the population. The availability of organic carbon has been shown to not only limit the growth rate of denitrifying bacteria, but also to limit the rate at which denitrification takes place (Brettar, 1992). Chemical entities other than organic carbon, such as inorganic phosphate, also can function as limiting nutrients (Rivkin, 1997). Indeed, given the rapid and dynamic shifts in marine bacteria metabolic behavior over time in response to changing nutrient availability, it may be inappropriate to describe marine bacteria as being limited by a single nutrient. The frequency with which nutrient enrichments are supplemented has the potential to exert a significant effect on bacteria populations. Nutrient regimes of different periodicities have been shown to result in mixed heterotrophic bacterial communities with distinct physiological properties. It also was observed that the interplay between various bacterial strains and other participants within the microbial community may be equally as important as the selective forces of the environment in structuring microbial communities. Perhaps most interestingly, when replicate bacterial cultures were subjected to identical nutrient supplementation, the microbial community functionality was conserved despite the fact that community compositions were significantly different (Carrero-Colon, 2006). Thus, there appears to be a great deal of bacteria community plasticity in response to environmental changes, one of the hallmarks of bacteria as a successful species over evolutionary time. The Coral Holobiont A coral's holobiont is comprised of close associations between the coral animal itself, its symbiotic zooxanthellae, and a diversity of associated microbes including bacteria, archaea, algae, and fungi. These associations can take place in the coral's immediate environment, on its surface, within its tissues, and within its skeleton (if present). This paradigm emphasizes the potential contributions of each component to the overall function and health of the coral (Rypien, 2010). The dynamic nature of these relationships can be seen in a comparison between freshly collected corals from the Red Sea region that were then placed into marine aquaria. A microbial community shift in the bacteria inhabiting the surface mucus layer was documented for collected corals when placed into the captive marine aquarium. The differences that emerged between corals from natural and captive environments suggested an adaptation of the mucus bacterial communities to the different conditions (Kooperman, 2007). Disruptions within a coral's holobiont have the potential to negatively impact the coral's health. Altered bacterial community structures have been linked to both coral disease and bleaching (Kvennefors, 2010). Coral bleaching occurs if the endosymbiosis between corals and their symbiots disintegrates during stress (Ainsworth, 2008). Even so, shifts in the holobiont's bacterial community component may not be a direct cause of coral bleaching. While bacterial communities play important roles in coral stasis and health, environmental stressors appear to be the primary triggers for coral bleaching, and bacterial involvement in patterns of bleaching appear to be the result of opportunistic colonization (Ainsworth, 2008). "Probiotic" Application of Bacteria A "probiotic" can be defined as a live microbial adjunct that offers a benefit to animals, algae, plants, corals, or the ambient microbial community. This benefit can be assessed in terms of an improved use of food (i.e., enhanced nutritional value), enhanced disease resistance, or by improving the quality of the ambient environment (Verschuere et al., 2000). The introduction of live bacteria cultures into a marine aquarium may be viewed as a "probiotic" husbandry technique. Deterministic (non-random) factors influencing the survivability of bacteria that are deliberately introduced into a marine aquarium include salinity, temperature, oxygen concentration, and the quality and quantity of available nutrients. The development of a microbial community within a marine aquarium is also influenced by stochastic (random) phenomena: chance favors organisms that happen to be in the right place at the right time to enter the system and to proliferate if suitable conditions exist. It is this stochastic aspect that explains why different marine aquaria may evolve distinctly different microbial communities despite the appearance of nearly identical conditions. The idea that both environmental conditions and random chance influence the emergence of microbial communities provides the context for the concept of probiotics as biological conditioning and control agents. During a time period in which a stable microbial community in a marine aquarium is still emerging, a single addition of a live bacterial culture may suffice to achieve colonization and persistence in the ambient environment, provided that the strains being added are well adapted to the prevailing environmental conditions. When the environment already carries a relatively stable microbial community, it is more likely that a live bacterial culture will have to be added on a regular basis in order to achieve an artificially stable presence in the microbial community (Verschuere et al 2000). 1.4 Counting bacteria in the water column Probing all of the issues of bacterial commerce in the reef aquarium as listed in 1.1 above requires access to one specific experimental methodology; the capability to count bacteria in marine water. Enumeration (counting) bacteria in marine water samples proved to be a pivotal early technology in developing an understanding of the ecological significance of bacterial populations in various environmental niches (Robertson, 1989; Button, 1989; Troussellier, 1995; Marie, 1997). Early (and later) attempts to quantify marine bacteria by first culturing them in growth media mimicked the similar successful approaches of medical microbiologists in growing pathogenic bacteria with specific growth media that crudely reproduced the body's environment. Unfortunately, a lack of appreciation of appropriate growth media for "environmental" marine bacteria, as opposed to "human" bacteria, has resulted in culture efficiencies of no better than the 1-10% range (Porter, 2004). This limitation still holds true today. Consequently, alternative counting methodologies, which did not require independent culturing, were explored. One early and quite successful approach utilized direct counting via epifluorescence microscopy (Hobbie, 1977). This technique involves nothing more conceptually complicated than "manually" counting bacteria made visible via a microscope's optics. To implement this counting methodology, a water sample is filtered through a special polycarbonate filter with 0.2 um pores, and the bacteria laden filter pad is then examined under a special type of microscope. The bacteria that do not pass through the filter then can be counted using any one of several image analysis software packages. The bacteria must be stained in order to visualize them. It is a "direct" technique that provides an absolute count of bacteria present for a given volume of sample. It has the advantages of being relatively fast and technically easy, and it can account for bacterial "clumping" as is sometimes seen. In practice, it suffers from some limitations that can compromise its effectiveness. For example, one problem that arises is the limited lifetime of the "stain" - the light emitted from the microscope will photobleach the staining compound, rendering the bacteria invisible, on a time scale similar to that needed to complete the measurement. In addition, the entire surface of the membrane filter is too large to be examined, and so only selected areas are chosen and counted. Then, various assumptions are made about homogeneity of the sample, and mathematical algorithms are applied to the raw data set to permit extrapolation from the counted regions to the entire filter disk in order to estimate an overall count. Thus, there is a significant level of subjectivity that attends epifluorescence microscopy measurements ("Is that dim spot a bacterium whose stain has faded, or is it junk?" "Did the filtration process lead to a homogeneous distribution of bacteria on the filter, or was there wicking towards the outer rim of the circular disk?"). Nevertheless, an experienced operator can generate a self-consistent bacterial count rather rapidly. As an example, Fig. 1 illustrates the results of a bacteria staining/counting experiment with water from the author's 175-gallon reef aquarium. The bacteria are stained with a dye called SYBR1-Green (more on this dye below), and this photograph represents one "field" of the microscope's view. The entire 25 mm-diameter filter disk is composed of approximately 10,000 such fields. Note that there is significant variation in the size, and in the color intensity, of the green "dots"; which are bacteria? Figure 1. A photograph, taken with an Olympus BX61 epifluorescence microscope, of SYBR1-Green stained bacteria collected on a 0.2 um filter disk. The water sample originated from a 175-gallon reef aquarium. A second independent technique for marine water bacteria enumeration has emerged recently, once again from the medical microbiology community, as an alternative to epifluorescence microscopy; this newer methodology is called flow cytometry (Robertson, 1989). Flow cytometry, like epifluorescence microscopy, is a direct counting technique that requires initial bacteria staining. SYBR1-Green has emerged as the dye (stain) of choice for a variety of reasons, not the least of which are (1) its relative resistance to photobleaching, and (2) the fact that it turns "on", or glows green, only when it is embedded ("intercalated" is the correct term) into double-stranded DNA, see Fig. 2 (Marie, 1997; Noble, 1998; Lebaron, 1998). Thus, the stain used for these experiments only registers at the detector if it is intercalated in double-stranded DNA as would be found in biological specimens like bacteria, but not in random small particles of junk. One major advantage of flow cytometry over epifluorescence microscopy stems from the fact that crude water samples can be used without filtration, thus removing the possibility of inadvertent sample sorting and loss of some bacteria. In addition, incorporation of size-specific calibration beads in the sample allows for a crude determination of size, and so it is possible to discriminate between "objects" and exclude those outside of a given (bacterial) size range. Flow cytometry uses a sophisticated fluid transfer system that exploits hydrodynamic focusing in order to pass a bacteria-containing water sample that includes a known quantity of the added calibration beads through an aperture so that particles (bacteria, calibration beads, detritus, etc.) pass through a laser beam single file, Fig. 2. High-end optics collect and then focus the scattered light from each particle. Sensitive photodetectors then discriminate between the scatter and fluorescence from individual particles. The residence time of the stained bacterium in the laser beam is short enough that photobleaching is not a problem. Perhaps more importantly, all of the bacteria in a given sample volume can be counted both rapidly (~ 5 min for a 1 mL sample) and objectively by applying standard counting parameters that do not vary from sample-to-sample, operator-to-operator, or from day-to-day. A cytometer operator does have to decide which particle-based fluorescence intensities to include or exclude. Bacteria that have lost DNA possibly due to environmental conditions would exhibit very weak intensities and therefore might be missed. However, once the decision is made about what constitutes a baseline for intensities to include in the count, that baseline value remains constant for subsequent samples and experiments. Thus, this consistency, along with the size discrimination capability, adds another level of confidence that the objects counted as bacteria are actually bacteria. Flow cytometry does have some liabilities that are not shared by epifluorescence microscopy; the complicated fluidics can get clogged by detritus in the water column, and bacterial clumps, which are characteristic of some types of bacteria, can be missed. Finally, since cytometry is both a light scattering technique and a fluorescence measuring technique, the minimum size of the particle that can be detected is dependent on the wavelength of the light used and the aperture of the collection optics; in our experiments, wavelengths in the 0.4 - 0.6 um range impose a practical lower limit for distinguishing particle sizes of about 0.5 um, which is towards the lower end of bacteria sizes. Epifluorescence microscopy suffers from this drawback as well; detection limits in microscopy also are limited by wavelength and the quality of the microscope optics. Overall, the speed, convenience, and objective and unbiased counting protocol recommend flow cytometry as a useful technique for marine water bacteria enumeration. More recently, a third direct approach for estimating (not counting) bacteria in marine water samples has been described (Wegley, 2006). Figure 2. A schematic of a flow cytometry experiment (the final picture is used with permission from Sysmex Corp.) Several reports that compare the results of epifluorescence microscopy-based bacteria counting to flow cytometry-based bacteria counting have confirmed that there are only negligible differences between the measured populations of bacteria in both marine and non-marine water samples (Robertson, 1989; Monfort, 1992). In the experiments that follow, the flow cytometry technique is used exclusively to count bacteria in aquarium (and other) water samples. 2. Experimental Approach We adapted for our studies procedures reported to be successful for bacteria enumeration in marine water samples (Marie, 1999; Grégori, 2001). The protocol involves collecting a water sample in a sterile vessel, preserving it with formaldehyde solution, adding a precise quantity of 6 um diameter counting beads and SYBR1-Green dye to a measured portion of the sample, and running it on a Coulter XL cytometer (see Fig. 3). Dedicated data analysis software then provides a direct count of both the beads and the "bacteria" in a given volume of water sample. In these experiments, the counted "bacteria" include any particle that meets the following criteria: (1) it is between ~0.5 and 6 um in diameter, (2) it contains double-stranded DNA, and (3) it does not fall into a region of the data plot where control experiments indicate that only debris and/or chlorophyll-containing organisms (i.e., phytoplankton), and not bacteria, show up (more details below). The "countable" size range of ~ 0.5 - 6 um was chosen to overlap with the typical size ranges of bacteria from marine environments; some phytoplankton likely will "leak through" and be counted as well. We did not view including some phytoplankton in the overall bacteria count as a problem, since both of these water column microorganisms have TOC removing capabilities, and also both are likely to serve as food for filter feeders and other predators as well. Larger organisms (diatoms, ciliated protozoa, copepods, etc.) will not be counted by this method, nor will smaller organisms (viruses). Figure 3. The Coulter XL cytometer, run by Alison Place (Pennsylvania State University). 2.1 General experimental A 25.0 mL water sample was collected in a sterile VWR brand centrifuge tube and immediately 0.5 mL of a 37% aqueous formaldehyde solution as a preservative was added. The tube was capped, shaken vigorously, and placed in a -4oC freezer pending analysis. If this sample was drawn from an aquarium, an effort was made to avoid surface water. The tube was immersed upside down about 4" - 6" below the water surface, rapidly inverted, and then removed from the aquarium and drained until the volume was 25.0 mL. Other water samples either were collected on site (Florida Keys mangrove estuary) by this procedure, or the sample tube was simply filled to the 25.0 mL mark with the appropriate water specimen (Aquafina, RO/DI/0.2 um filtered, tap water, etc.) prior to formaldehyde addition. The samples were rapidly thawed by immersion in warm water just prior to analysis. After vigorous agitation via a Vortex mixer, three independent 960 uL samples were removed from each tube and placed in sterile 2 mL centrifuge tubes. Into each tube was placed 20.0 uL of a diluted (see below) SYBR1 Green solution and then 20.0 - 60.0 uL of a 3.3 x10⁷ bead/mL solution in 3 mM aqueous NaN3 (as a bactericidal agent) (volume depended upon the anticipated bacteria count). The SYBR1 Green stock solution was freshly prepared just prior to each run as follows: 20 uL of a commercially available solution of SYBR1 Green in DMSO (Invitrogen; the exact concentration is proprietary information, but the dilution that we used follows their suggested cytometry protocols) was added to 380 uL of an aqueous DMSO solution that was made from 40 uL of DMSO + 360 uL of RO/DI/0.2 um filtered water. This solution was vigorously mixed with a Vortex mixer, passed through two successive 0.2 um filters, and used immediately. The bead solution was prepared by adding 10 uL of a 3.3 x 10⁸ bead/mL stock solution (Polysciences) to 90 uL of 3 mM aqueous NaN3. This solution was vigorously mixed with a Vortex mixer and used immediately. The 1000 - 1040 uL sample (water sample + beads + SYBR1 Green) was inserted into the Coulter XL inlet and the enumeration run was initiated and monitored by the dedicated software. Note that each water sample was run in triplicate. 2.2 Control experiments and bacterial contamination Several of the procedures described above were tested for the possibility that contaminating bacteria were introduced, by running appropriate controls. For example, the formaldehyde solution was pre-filtered through a 0.2 um filter prior to use, although we observed that ± this filtration treatment did not lead to any significant difference in bacteria counts for the same water sample. Testing for bacterial introduction via contaminated reagents, or through contamination in the XL cytometer itself, was conducted along with every run. A "blank" composed of pure RO/DI/0.2 um filtered water, either treated with formaldehyde or not, was used for this test. In all cases, the blank bacteria counts were < 10000/mL, and in most experiments < 2000/mL. In comparison, actual bacteria counts in marine water were on the order of 105 - 106 bacteria/mL. The effect of freezing the samples on bacteria counts was tested by splitting a sample between fresh and frozen, and running both samples on different days. No significant differences between fresh and frozen bacteria counts were observed. On the other hand, leaving a formaldehyde-treated sample at room temperature for several days before analysis led to an approximately 10-20% decrease in the bacteria count compared to a freshly run sample. 2.3 Data workup The Coulter XL Flow Cytometer has sophisticated internal electronics that aid in one of the primary functions of the instrument in addition to strictly counting; "gating", or discriminating among the particles in the sample in order to analyze the specific species of interest, in this case bacteria and other microbes of related size. Because flow cytometry counts particles irrespective of sample volume, beads with known concentrations are counted in the same volume as the bacteria, thus permitting the determination of the sample volume holding a certain count of bacteria (=> bacteria "concentration"). The use of the fluorescent indicator SYBR1-Green provides the means to identify and then count "objects" that correspond to bacteria. In addition, the added 6.0 um diameter calibration beads, which are chosen to have physical characteristics that allow them to be easily distinguished from bacteria, are identified and counted. The emission spectrum of SYBR1-Green bound to double stranded DNA is illustrated in Fig. 4 below. In order to discriminate between actual bacteria and similarly sized detritus and phytoplankton (to a degree), we measure and plot the intensity of the green fluorescence (530 nm, the top of the large peak of the green line) vs. the red fluorescence (the signal at 610 nm). Note that for SYBR1-Green, the green/red signal strength ratio is a constant, ~ 7:1. Thus, any increase in green fluorescence intensity (530 nm), such as might accompany, for example, multiple and independent binding of several SYBR1-Green molecules to the double stranded DNA of a single bacterium, should be matched by a proportional increase in the red (610 nm) signal; that is, plotting green vs. red fluorescence intensity should produce a straight line. In actuality, it produces an elliptical region on the red/green plot illustrated in the representative cytogram shown in Fig. 5c below. Note that damaged or stressed bacteria might have less highly coiled DNA, which could alter the green/red ratio as well. Figure 4. Absorption and emission spectra of SYBR1-Green bound to double stranded DNA (from Wikipedia). The drawn perimeter in this Green/Red plot (Fig. 5c) contains the counted responses. All other detector responses outside of this region are ignored. What is the basis of ignoring these other responses? In actuality, there are two factors that contribute to the choice of the region to count. (1) Plankton-derived contaminants, in particular chlorophyll-containing detritus, have a natural red autofluorescence (Marie, 1999). Thus, signals that have "too much red", i.e., are off the counted ellipse toward the higher red end, are likely to reflect contamination by phytoplankton/chlorophyll (or possibly other red autofluorescing detritus). These particles are less likely to be examples of the bacteria of interest, which lack chlorophyll, and so they are omitted. (2) Pure water blanks that lack any substantial bacteria are run to establish a baseline detritus region on the red/green plot. These bacteria-independent signals tend to congregate at low green fluorescence intensity and towards the higher red end (lower right of the Fig. 5b red/green plot). They can be easily avoided when determining the bacteria count (= the L-gate) by excluding them from the counted region, as illustrated with Fig. 5c. As a practical matter, we can count these "excluded" signals as well by using data within the FS/SS graph (= entire population of counted signals; FS = forward scatter, SS = side scatter), and typically the excluded signals ( bacteria) in the red/green graph constitute about 10 - 40 % of the entire population of counted signals. So, most of the particles that meet the "bacteria" size criteria are counted in any event. For example, in Fig. 5c, 10000 out of a possible 13647 signals are counted as bacteria. By this analysis, it is apparent that, much like with epifluorescence microscope visual inspection, the instrument operator must make a decision about which data points correspond to valid bacteria counts, and which do not. Both techniques use a dye (SYBR1-Green) that only lights up when attached to objects containing double-stranded DNA, so that requirement eliminates most similar-sized but non-bacterial detritus. However, with cytometry, there is one additional and valuable input criterion that can be used to distinguish bacteria; red/green intensity plots. Thus, a second check on non-bacterial detritus/phytoplankton can be accomplished. Figure 5a. Representative cytograms. FS/SS plots of precisely sized polystyrene calibration beads, indicating the region in the FS/SS plot where bacteria-sized particles might be found. Figure 5b. Representative cytograms. A RO/DI/0.2 um-filtered "bacteria-free" water blank, illustrating the region of the red/green cytogram where non-bacterial signals are found. Figure 5c. Representative cytograms. A typical (unskimmed) aquarium water sample; both FS/SS and red/green plots are illustrated. The bacteria count corresponds to the L-gate region of the red/green graph. The counts from two gates illustrated on the cytogram in Fig. 5c are relevant to the bacteria enumeration question; the L gate, which displays the count of bacteria, and the E gate, which displays the bead count. The instrument is set up to stop counting when the bacteria count reaches 10000 or after 300 seconds have elapsed, whichever occurs first. The former criterion is almost always reached in authentic marine water, reflecting the relatively large (compared to blank controls) number of bacteria present. In water blanks, considerably less bacteria are counted and the 300-second limit is usually reached. The real number of value, then, is the bead count from the E gate. Since we know the concentration of beads in the sample, and the cytogram gives us the ratio of beads counted to bacteria counted for a given volume of sample (the amount that passes until the bacteria count reaches 10000), we can use a simple ratio to get the bacteria population in a known volume of the sample. An illustration of the calculation for the data in Fig. 5c is given below: Bead population: 3.29 x 10⁷ beads/mL starting stock solution concentration x 0.060 mL = 2.0 x 10⁵ beads added to the sample. The sample volume = 0.960 mL + 0.060 mL (bead solution) + 0.020 mL (SYBR solution) = 1.040 mL total volume, so the final bead concentration = 2.0 x 10⁵ beads/1.040 mL = 1.9 x 10⁵ beads/mL. So, bacteria/mL = bacteria (L-gate)/beads (E-gate) x 1.9 x 10⁵ beads/mL However, we have not yet accounted for either (a) the initial dilution of the 25.0 mL sample by addition of 0.5 mL of formaldehyde, or ( the dilution of this water/formaldehyde solution upon addition of the bead solution and the SYBR1-Green solution. So, we have to multiply the above quantity by both (a) 25.5 mL total volume/25 mL sample volume (= 1.02) and ( 1.040 mL total volume/0.960 mL sample volume (= 1.08): (1) Bacteria/mL = L-gate(bacteria #)/E-gate(bead #) x 1.9 x 10⁵ beads/mL x 1.02 x 1.08 Eq. (1) is the formula that allows us to arrive at a bacteria population in a water sample from the raw cytometer data. In the specific case illustrated in Fig. 5c, bacteria/mL = 10000/2049 x 1.9x105 x 1.02 x 1.08 ~ 1,021,149 bacteria/mL. Significant figure restrictions ("0.060 mL" of bead solution is only reported to 2 significant figures) would require that this value be reported as 1,000,000 bacteria/mL. Each water sample was run in triplicate, and the averaged values with standard deviation (although not technically applicable to a three sample data set) are reported in the Results section below. 3. Results and Discussion 3.1 Baseline bacteria counts The initial experimental foray in reef tank water bacteria enumeration was focused on establishing baselines for bacteria populations under different husbandry regimes. Later, these baselines will be used as comparison points in experiments where the system is perturbed, either by carbon dosing or by mechanical filtration (skimming, GAC). Much prior effort in the area of bacteria counting from authentic reef water has led to an expansive body of work. A few representative examples are documented in Table 1, where bacterial counts from reef water in Hawaii, Micronesia, Key Largo, and the Northern Line Islands all converge on a span of bacteria populations in the 500K - 1500K/mL range or so. The counts from the Northern Line Islands, Ponape Island, and Key Largo were derived from epifluorescence microscopy measurements, whereas the Kaneohe Bay data were acquired via flow cytometry. In addition, we sampled water from a mangrove estuary in the Florida Keys, and not surprisingly, this highly sedimented shoreline water exhibited a bacterial population (3300-4400K/mL) much higher than those observed in the more pristine reef waters. These values serve as standards for comparison to aquarium water, and they will help address the question, "Are our reef tanks similar to, or different than, an authentic reef with respect to water column bacterial populations?" A second series of bacterial counts focused on control water samples of various origins. These data represent low-end standards that delineate the limits of our counting technique. For example, every experimental run was accompanied by an RO/DI/0.2 um filtered water blank to ensure that the flow cytometry instrument itself was not a source of bacterial contamination. It did not seem to matter whether these samples were treated with formaldehyde preservative or not; similar counts were obtained in both cases. Overall, these "sterile" water blanks typically displayed counts in the 1000 - 5000 bacteria/mL range; occasionally, values as high as 10000 bacteria/mL were observed. Since bacteria counts of authentic aquarium or marine water samples were 1-2 orders-of-magnitude greater than these blank values, we concluded that instrument contamination was not likely to increase the measured bacteria counts in any significant way. Both Aquafina bottled water and the RO/DI water produced in the 175-gallon aquarium make-up water system were almost sterile: < 1500 bacteria/mL. State College Pennsylvania tap water, on the other hand, did carry a modest bacterial load; 27K/mL. The surveyed reef aquariums divided into two distinct sets of husbandry protocols; aggressive and passive (see Fig. 6 for pictures of these aquariums). The aggressive husbandry practices included protein skimming, GAC filtration, and regular water changes in an active effort to scrub the water of nutrients. The passive approach did not involve any of these procedures. Interestingly, the aquaria subjected to passive husbandry exhibited bacterial counts that fell within the range seen on authentic reefs; 200 - 1000K/mL. On the other hand, the tanks that "benefited" from careful attention to nutrient removal protocols displayed bacteria/mL counts that fell far short of these numbers; only 90-140K/mL. In addition to monitoring water column bacteria counts, the TOC (Total Organic Carbon, see Feldman, 2008) levels were examined as well. Not surprisingly, the tanks with "unpurified" water exhibited TOC levels greater than those seen with the skimmed/GAC-filtered tanks. The "purified" aquaria's TOC levels fall within the typical TOC range seen on authentic, healthy reefs (Feldman, 2008); the passively husbandry tanks were 2-3x higher. The observation that, at least among this small set of aquaria examined, the water within the skimmed/filtered tanks had only ~ 1/10th of the population of bacteria that the unskimmed/unfiltered tanks had was a real surprise. It speaks to one aspect of aquarium husbandry in which a perhaps important parameter (?), water column bacteria counts from authentic and healthy reefs, is not reproduced at all effectively in these home aquaria. Sensitive corals, like Acropora, do not thrive in the high-bacteria-count/high-TOC-level tanks examined, although soft corals do well (see pictures). On the other hand, SPS corals do well in the low-bacteria-count/low-TOC-level tanks (Fig. 6). These observations raise a number of questions, chief among them perhaps are, (1) "Do water column bacteria counts have any relevance to the short-term or long-term prospects for maintaining SPS in captive aquaria?", and (2) "What is the relationship between TOC and water column bacteria population?" The former question, whereas perhaps more interesting, remains unanswered. The latter question (TOC vs. bacteria population), which bears on the topic of carbon dosing, will be addressed below. Table 1. Bacterial counts from authentic marine water, various control samples, and several reef tanks. Sample Water volume (gal) skimmer GAC GFO Water change TOC ppm Sandbed Bacteria/mL aMonger, 1993 bDinsdale, 2008 cYoshinaga, 1991 dPaul, 1993 eThis work Kaneohe Bay, Hawaiia800-1500KNorthern Line Islandsb50 - 800KPonape Island, Micronesiac800-1600KKey Largo, Floridad300-1000KMangrove estuary, Fl. Keyse3300-4400KRO/DI/0.2 uM filtered H2O1-10KKSF RO/DI1.1±0.3KAquafina1.5±0.5KState College PA tap water27±6KSanjay 5555nononorarely2.72no590±70KSanjay 2929nononorarely1.69no1000±80KSanjay 2828nononorarely2.14yes220±10KKSF 175168yesyesyes17%/wk0.50yes105±10KPSU HUB 500500yesyesyes10%/wk1.0yes91±13KSanjay 500 Zeovit500yesyesyes14%/2-3 wks0.90yes140±10KThe reef aquariums that were monitored for their bacterial populations: Figure 6a. KSF 175 gallon reef tank Figure 6b. SJ 500 gallon reef tank Figure 6c. SJ 55 gallon reef tank Figure 6d. SJ 29 gallon reef tank The bacteria/mL counts for the aquaria described in Table 1 reflect single-time-point measurements, and it is possible that hourly, daily, or other fluctuations in bacterial populations have been missed. These modulations in bacterial populations might result from the light on/off cycle, food additions, pH swings, etc. In order to probe this point, a few week-in-the-life longitudinal studies were conducted on both the 175-gallon reef tank and the 55-gallon reef tank. The first experiment covered 5 days of typical aquarium life, with the skimmer deliberately off for the first three days, the UV sterilizer on, and the GAC and GFO filters on, Fig. 7. Over the course of this experiment, the water column bacteria population fluctuated between ~ 95K and 115K bacteria/mL, a ~ 20% spread in values. The skimmer was turned off at t = 0, and the count rose steeply over the next 12 hours, and then declined to the starting point at the 2-day mark. At that point, a gradual rise to the maximum recorded value, 115K/mL occurred. Turning the skimmer back on at the 3.5-day mark may have slowed the rate of this increase slightly, but the data are not compelling on this point. It is temping to attribute the initial steep rise to a presumed corresponding increase in the carbon source TOC, since the TOC-removing skimmer was turned off at t = 0. During this growth phase, nitrogen and phosphorus nutrients as well as C would be stripped from the water column also. In this interpretation, the subsequent decline in bacteria population at the 12-hour mark might reflect a depletion of these N and P nutrients required for bacteria population growth; that is, perhaps the initial growth spurt might reflect an increase in C concentration (skimmer off) in a C-limiting bacterial growth regime, and the subsequent decline at 12 hours might indicate a switch over to a N and/or P limited growth regime. This hypothesis dovetails nicely with the Carbon Dosing ideas described earlier. However, it is important to appreciate that simply observing the expected result of a hypothesis does not validate that hypothesis - the strongest conclusion that legitimately can be offered is simply that the data is consistent with the predictions of the hypothesis. Other interpretations of the bacteria population data in Fig. 7 cannot be excluded at this point. Furthermore, the "rebound" in bacterial growth after 2 days is more difficult to interpret without some further knowledge about commensurate C, N, and P levels in the tank. A more controlled experimental plan to monitor bacteria population change contemporaneously with C and N concentration measurements might settle this issue; this experiment will be discussed shortly. Figure 7. Bacteria/mL counts from a 175-gallon reef tank (See Fig. 6) over the course of 5 days. The tank was fed 3-4 times/day (PE mysis shrimp, Hikari mysis shrimp, flake food, and pellet food) during the "on" part of the daily lighting cycle. One concerning point in the experiment described in Fig. 7 involves the role that the UV sterilizer might play in influencing bacterial levels; Are we killing significant numbers of bacteria by UV treatment, thus suppressing population growth? The UV sterilizer in use is a 57W flow-through model from Aqua Ultraviolet. In order to probe this question, we re-ran the "week-in-the-life" experiment with the UV sterilizer off, but the skimmer on continuously, Fig. 8. The observed bacteria/mL values over the course of 5 days fluctuated between 60K and 90K (~ 50% change) for this particular time period. Thus, there did not appear to be any significant bacteria population increase in the water column when the UV sterilizer was off, and it is probably safe to conclude that the UV sterilizer does not have a significant effect on the bacteria population levels in the tank's water column. Figure 8. Testing the influence of UV sterilization on bacterial populations in the water of a 175-gallon reef tank. The feeding regimen described with Fig. 7 was used in this experiment as well. A final "week-in-the-life" experiment was conducted on the 55-gallon tank lacking any active filtration, Fig. 9. In addition, this tank had been treated daily with vodka as a carbon source for 6 months prior to water removal. This vodka addition started after the original bacteria population reading reported in Table 1 was taken. Since there was no active bacteria removal mechanism (i.e., skimming), it was not clear, a priori, how the bacteria population might change compared to the pre-vodka value of 590±70 K/mL. In fact, the bacteria population clearly had risen to a significantly higher level than observed in the pre-vodka time period, and now it hovered around 1500-2500K/mL. Once again, significant (~ 60% !) fluctuations in bacteria/mL counts over time appear to be the norm, at least for the two aquaria examined. Figure 9. Bacteria/mL counts from a 55-gallon reef tank (See Fig. 6) over the course of 5 days. No protein skimming or GAC filtration was employed on this tank. The tank was fed frozen mysis shrimp daily. In addition, a vodka dosing regime of 4 mL of 80 proof/day (= 3 ppm of C/day) was in place for 6 months. Overall, the major conclusions from these preliminary studies on baseline bacteria counts are Actively purified aquaria have water column bacteria populations that are approximately 1/10th those of authentic healthy reefs. Unpurified aquaria have water column bacteria populations that are approximately the same as those of authentic healthy reefs. UV sterilization does not significantly influence aquarium water column bacteria populations. There is substantial fluctuation (20-50%) in the measured water column bacteria populations over a several-day time scale in aquaria. 3.2 Carbon dosing (planned and inadvertent) - How does it affect water column bacteria levels? The data from section 3.1 established that skimmed/GAC filtered aquaria exhibited baseline bacteria/mL counts in the 70-140K/mL range, whereas unskimmed/GAC-less tanks had approximately 10x that amount. Furthermore, the bacteria level fluctuated on a daily basis as much as 20 - 50%. Now it was time to examine how these baseline bacteria/mL levels responded to deliberate carbon addition. If bacteria population growth is carbon-limited, we might anticipate a significant increase. If it is not, the bacteria population numbers shouldn't scale with carbon dose. In the first trial, we removed 30 gallons of water from the KSF aquarium approximately 17 hours after the last feeding, and about 1 hour after the lights came on. This water sample was placed in an uncovered Rubbermaid tub with continuous powerhead mixing. The fact that the tub was left uncovered might lead to some bacterial introduction via airborne sources; we felt that this configuration best approximated how an aquarist might actually run their aquarium/water change apparatus. Ethanol (EtOH) was dosed as a rate of 0.29 mL/day (= 1 ppm of C/day). Water samples were removed just before each EtOH dose over the course of 5 days. In addition, TOC levels were measured over this time period, and beginning and ending [NO3] values were recoded with a Salifert kit. The [PO4] level was unmeasurable via the Merck kit (< 0.024 ppm). The results are displayed in Fig. 10. The initial bacteria/mL population increased from 80K/mL prior to the first EtOH dose up to about 1200K/mL (~ 15x increase) over the course of a day, and maximized at 3900K/mL (~ 50x increase) after 2 days. The bacteria level then receded to about 1500K/mL (~ 19x increase) at the 5-day mark. The TOC level changes started predictably; the initial level = 0.61 ppm, and just after addition (3.5 h mark) of 0.29 mL of EtOH (~ 1 ppm of C), the recorded TOC level elevated to 1.58 ppm. Thus, the addition of EtOH did, in fact, raise the TOC level the expected amount- an internal check on the measurement methodology. The curious and potentially revealing observation came after the 1-day mark; continued additions of EtOH did not lead to increases in the TOC level at day 2 and day 3, and only slight increases (~ 33%) at day 5. The [NO3] value decreased from 2.5-5 ppm at the beginning of the experiment to 1-2.5 ppm at day 5. The uncertainty in reading the results of the Salifert kit make drawing any definitive conclusions about nitrate reduction over this experimental time course difficult. Figure 10. Changes in bacteria/mL count and TOC levels in a 30-gallon volume of KSF reef tank water (see Fig. 6) upon daily EtOH dosing at a rate of 0.29 mL/day (= 1 ppm of C/day). This water was contained in an uncovered Rubbermaid tub equipped with two powerheads and exposed to fluorescent room lighting. These observations can be interpreted within the context of the carbon dosing hypothesis described earlier, specifically the initial premise that addition of a metabolizable carbon source will lead to an increase in the bacteria population (i.e., bacteria growth is C-limited in aquarium water). Over the first 2 days, bacteria growth does respond as predicted by this hypothesis. In addition, the TOC behavior can be rationalized in light of this hypothesis as well; the initial and subsequent day 2 additions of EtOH (= TOC) are consumed by bacteria, both fueling growth and depleting, or at least stabilizing, the TOC pool. Although the TOC load within intact bacteria will be picked up by the TOC analyzer, it is likely that normal bacterial metabolism will convert a lot of this TOC into CO2, which will not be detected by the TOC analysis. However, at the approximately 2-day mark, the dynamic situation in this water volume changes; the bacteria population declines, and the TOC level begins to rise. Perhaps at this time point, the growth in bacteria population is no longer carbon limited, and so further carbon addition doesn't fuel growth. Continuing on in this speculative vein, perhaps in the presence of now surplus carbon, bacterial growth is now limited by the availability of some other nutrient (N or P). In this interpretation, the growth in bacteria population over days 1 and 2 would have depleted enough N and/or P from the water that one (or both) of these nutrients is now deficient from the bacterium's perspective. Of course, from the aquarist's perspective, this depletion of N and/or P in the water column is desirable and in fact is the whole point of the carbon dosing procedure. We sought to repeat this experiment, given our caveat from above ("observing the expected result of a hypothesis does not validate that hypothesis - the strongest conclusion that legitimately can be offered is simply that the data is consistent with the predictions of the hypothesis"). However, in this second trial, we included a control experiment for testing the importance of the EtOH addition itself to bacteria growth. Specifically, we ran the 30-gallon water sample experiment exactly as described for Trial 1, and the data are reported as the aqua (bacteria/mL) and blue (TOC) lines of Fig. 11. These data follow closely those from Trial 1; an initial rapid bacteria population rise (~ 30x the initial level) over the first day, followed by a slight decline over the next few days. The TOC level's response was consistent with Trial 1 as well; an initial ~ 1 ppm (0.64 ppm to 1.89 ppm) jump upon the first EtOH addition followed by a decline as bacterial growth peaked, and then a slight rise as (perhaps) the bacterial population entered a non-C-limited growth phase. The real surprise is the red line of Fig. 11; it documents the substantial increase in bacteria/mL for a control water sample that was not treated with EtOH. We simply removed about ½ gallon of water from the tub at the beginning of the experiment, and placed it in an open Tupperware container under fluorescent room lighting. This control portion of tank water was sampled for bacteria content daily just like the EtOH-treated larger tub water sample. Remarkably enough, the bacteria population in this control sample experienced a slower but still significant rise, increasing to a maximum of ~ 27x the original level after 3 days. What is fueling this bacterial growth? Since we have already determined that the bacteria population in this aquarium water sample is carbon limited, it seems reasonable to hypothesize that the Tupperware vessel itself is providing a metabolizable source of carbon! This vessel had been used in various water transfers previously, and it was rinsed with tap water and dried between uses. Could organic residue or bacterial films coat the plastic? Is the plastic itself "digestible" to the water column bacteria? These questions are not answerable at present, but the overall observation that the plastic container itself (or residue on its surface), and not necessarily the EtOH addition, can contribute to a significant increase in water column bacteria population raises some concerns about the interpretation of the results in Fig 10 (remember the caveat). Figure 11. A second trial recording changes in bacteria/mL count and TOC levels in a 30-gallon volume of KSF reef tank water (see Fig. 6) upon daily EtOH dosing at a rate of 0.29 mL/day (= 1 ppm of C/day). This water was contained in an uncovered Rubbermaid tub equipped with two powerheads and exposed to fluorescent room lighting. In this experiment, a control water sample was removed and held to the side in a plastic vessel with no EtOH addition. These observations prompted a more direct examination of the actual Rubbermaid tub's capacity to contribute to bacterial growth - maybe the Tupperware vessel was unusually contaminated with organics. In this experiment, we removed a 30-gallon water sample from the KSF aquarium and transferred it to the uncovered Rubbermaid tub, as described previously. Water circulation was provided by powerheads but otherwise the system remained undisturbed. Water samples were withdrawn daily for 5 days, and the bacteria/mL counts are displayed in Fig. 12. Clearly, the tub itself (or organic material coating it) is providing a suitable carbon source for bacterial growth. The bacterial population rises some 26x over the initial value over 2.3 days, before declining slightly; a rationale for the burst in bacteria population at day 5 cannot be offered at present. Do these control experiments negate the carbon dosing hypothesis? No. These results merely suggest that ANY metabolizable carbon source, whether it is unknown organic "stuff" from the surface of a Rubbermaid tub or deliberately added EtOH, will fuel bacterial growth in a C-limited environment such as, apparently, aquarium water. The Rubbermaid tub was cleaned out with tap water and then distilled water between uses. Any solid buildup was removed by rinsing with 1 M HCl followed by distilled water. So, this protocol, which might reflect the typical procedures used by an aquarist for their make-up water or saltwater holding containers, clearly contributes to an organic-rich environment that promotes bacterial growth. This observation may hold some interest to aquarists who believe that they need to seed their tanks with bacteria ("probiotics") as part of a carbon dosing scheme to lower nutrients, and therefore are contemplating purchasing a bacterial "elixir" to accomplish this seeding. Figure 12. Bacteria/mL count in a control experiment wherein 30 gallons of KSF tank water was removed and placed in the Rubbermaid tub. A Bubble King mini 160 protein skimmer and two powerheads were included, although the skimmer was not turned on. No EtOH was added; the water sample was exposed to air and fluorescent room lighting. The observation that a plastic container, which is re-used in the course of normal aquarium husbandry, can contribute carbon nutrients to fuel bacterial growth opened up a new line of inquiry; what role might standard water changes that use such containers play in modulating (increasing) bacterial levels in reef tank water? Specifically, can water-change water introduce significant bacteria populations into the aquarium? This question was probed by simply monitoring the bacteria/mL count within a 30-gallon saltwater sample made to 35 ppt salinity by mixing Instant Ocean Reef Crystals salt mix with 30 gallons of distilled water in a loosely sealed Rubbermaid garbage can (different than the tub used for the previous experiments). This container had been used for weekly water changes for the preceding 6 years. Following each water transfer, the container was washed with distilled water and wiped dry prior to mixing the next batch of saltwater. Furthermore, it was periodically cleaned with 1M HCl to remove solid deposits, but in general it carried with it some solid residue on the plastic surface. The data (Fig. 13) unequivocally illustrate that indeed this freshly mixed saltwater is a major source of bacteria introduction into the KSF reef tank. The initial distilled water exhibited negligible bacteria population (~ 10K/mL), but that value increased dramatically to over 900K/mL in just one day after IORC addition. The bacteria/mL value decreased and leveled off at ~ 500K - 600K/mL by day 2. Thus, preparing IORC saltwater under typical aquarium husbandry conditions does lead to a remarkable bacteria load, fueled by some as yet unidentified carbon source, although it should be noted that IORC does include "extra vitamins" that could serve as an organic carbon fuel source. The bacteria population peaked in this experiment at about the 1-day mark, suggesting that addition of this saltwater to an aquarium after one day of mixing, as part of a routine water change, could serve as a inexpensive, simple and functionally useful way to introduce bacteria. This premise was tested next. Figure 13. Bacteria/mL count of 30 gallons of saltwater (salinity = 35 ppt) mixed in a 35-gallon Rubbermaid garbage can; the saltwater was prepared from Instant Ocean Reef Crystals (IORC) and distilled water. The container was loosely covered; the water was continuously mixed with a powerhead and heated to 75 oF with a heater. Does adding bacteria-rich saltwater to a reef aquarium increase its bacterial load? This question was probed by the experiment described in Fig. 14. As part of routine weekly tank maintenance, 30 gallons of water was removed from the KSF aquarium, and immediately 30 gallons of IORC saltwater (bacteria count = 280K/mL in this instance) was added. The KSF tank bacteria/mL count was monitored daily over the course of a week; midway through this experiment, a second smaller water change with Instant Ocean saltwater (bacteria count not measured) was conducted. The active filtration (skimmer/GAC/UV) was on throughout the week-long time course. As illustrated in Fig. 14, the tank's bacteria population did experience a sharp increase upon addition of the bacteria-rich water-change saltwater; after 2 hours post IORC saltwater addition, the count increased by 1.7x. Likewise, by 1 day post IO saltwater addition, the count had enlarged again, also by 1.7x. So, addition of bacteria-rich saltwater does indeed lead to an observable and significant increase in the tank's bacteria population. In fact the dilution math works out perfectly and serves as an internal check of the counting methodology, much like it did with the TOC analysis of Figs. 10 and 11. Specifically, the entire tank water volume is 168 gallons. Adding 30 gallons of 280K bacteria/mL to 138 gallons of tank water (total volume - amount remove during water change) of 61K bacteria/mL should lead to a predicted final 168 gallon volume at 100K bacteria/mL - at 2 hours after the water change, the bacteria/mL was measured at 101±5K/mL. Figure 14. Bacteria/mL count of KSF's reef tank after water changes of 17% (Instant Ocean Reef Crystals) and then 7% (Instant Ocean). The more interesting observation is what happens after the bolus of bacteria is added with the water change. After both water changes, the ~ 1.7x increase in bacteria count diminished back to a "baseline" value for the KSF aquarium of ~ 60-70K/mL within one day. The bacterial population at any instant will be determined by the interplay of population-increasing events (direct addition of bacteria and growth, if appropriate and sufficient nutrients are present) and population-decreasing events, such as death and predation by higher organisms in the food chain. The fact that a rapid increase in bacteria is equally rapidly "absorbed" so that an equilibrium level is maintained speaks to the dynamic nature of these events. The larger microfauna and sessile filter feeders seem to be likely candidates for bacteria removal culprits that in concert balance out any induced spike in population. The level of bacteria addition that might overwhelm this balance is not known, but the fact that a biological "mechanism" appears to be in place in order to return population swings to an equilibrium level poses an interesting problem for the carbon dosing hypothesis; perhaps higher bacteria levels cannot be sustained in an authentic reef tank even upon carbon dosing, if the bacteria consumption mechanisms increase in kind. In this scenario, nutrient "export" would occur, at least in part, via bacteria consumption by endogenous organisms and not just by physical removal from the water via protein skimming; that is, some of the nutrients would stay in the system, albeit in new trophic levels. This issue of water column bacteria population increase via carbon dosing in an authentic, thriving reef tank can be probed directly, and the results of that experiment are described below. First, however, there is one more question on the topic of (inadvertent) bacteria addition via water changes that should be addressed; do the bacteria come from the salt mix itself, or are they introduced via the (non-sterile) mixing vessel? This question was examined by removing the container as a source of bacterial contamination and/or food. Specifically, saltwater mixes (to 35 ppt salinity) were prepared from RO/DI/0.2 uM-filtered water in sterile plastic Erlenmeyer flasks (Nalgene 500 mL sterile disposable PETG flask). Six salt mixes were examined: Instant Ocean Reef Crystals (IORC), Instant Ocean (IO), Tropic Marin, Oceanic, Red Sea, and Kent, and the bacteria population in each flask was monitored over 5 days. The flasks were all sealed and covered with aluminum foil to avoid exposure to standard fluorescent room lighting. A control flask containing only RO/DI/0.2 uM-filtered water was included, and the results are depicted in Fig. 15. Figure 15. Bacteria/mL count of six different brands of salt mix made up to 35 ppt salinity using RO/DI/0.2 uM filtered water in capped and foil-wrapped sterile flasks. Five of the six salt mixes (Red Sea excepted) displayed little bacterial contamination beyond the pure water control, and the bacteria populations fluctuated but did not consistently rise over time as might be expected if sufficient nutrients were available (cf. Fig. 13). Thus, there is no reason to suspect that any of these five salt mixes themselves contribute to the high levels of bacteria in the make-up saltwater of Fig. 13. Red Sea salt, on the other hand, does appear to bring with it a not insignificant bacterial load. Once again, there was little increase over 5 days, indicating that sufficient nutrients for growth were not available under these "sterile" conditions. What is so special about Red Sea salt? This salt, uniquely among the six mixes tested, is made, at least partially, by drying authentic seawater. Thus, it appears to retain some viable bacteria from the drying process. The other five salt mixes are prepared from mixing strictly chemical sources of the components. Overall, it appears justified to conclude that the significant populations of bacteria in mixed saltwater are a result of container contamination and not salt mix introduction per se. The final question of merit in testing the "carbon addition" part of the carbon dosing hypothesis was alluded to earlier; what happens in authentic reef tank water over time upon deliberate addition of a carbon source? Will the natural bacterial population control mechanisms handle the induced population growth so that the normal equilibrium level of bacteria is maintained? Or, will these mechanisms be overwhelmed and therefore will the bacteria population rise? To probe this key point, we adopted the carbon dosing protocol described by Walton and Bjornson (Walton, 2008). Specifically, we added pure EtOH to the KSF 175 gallon reef tank at the following schedule: Day 1-4: 0.28 mL (~ 0.l7 ppm of C in the tank volume of the KSF aquarium) Day 5-8: 0.58 mL (~ 0.35 ppm of C) Day 9-15: 0.78 mL (~ 0.47 ppm of C) Day 16-21: 0.98 mL (~ 0.60 ppm of C) Day 22-27: 1.18 mL (~ 0.71 ppm of C) Day 28-30: 1.38 mL (~ 0.84 ppm of C) The EtOH was adding in the early morning, prior to lights on, and approximately 17 hours after the last tank feeding. Water samples for bacteria count analysis were removed just prior to the EtOH addition. Periodic measurements of [NO3] via the Salifert kit were conducted also. During this month-long experiment, the tank was maintained under its normal husbandry conditions; a weekly 30 gallon (17%) water change with IORC saltwater (standing for 1 week prior to use), biweekly change of GAC and GFO, continuous protein skimming (H&S 200-1260), UV sterilization, light cycle of 8 hours on/16 hours off. The results of this experiment are illustrated in Fig. 16. Figure 16. Bacteria/mL count and [NO3] in the KSF reef tank over 30 days with incrementally increasing EtOH dosing. The interpretation of this experiment is clouded somewhat by a complicated backstory. This experiment as described above was planned to proceed over 30 days. Unfortunately, at the 20-day time point, the Coulter XL cytometer broke, and it took several weeks for the instrument to be repaired. The data for the three weeks of samples were compromised, and the entire experiment had to be re-run. The KSF 175 gallon aquarium was maintained as described above for 2 more months without EtOH addition before the dosing experiment was restarted, following the protocol described above, and the data displayed in Fig. 16 came from the second complete run. However, between approximately the 2nd week of the initial EtOH addition experiment and the start of the second EtOH experiment about 9 weeks later, two significant changes in the KSF aquarium were observed. Cyanobacteria made an unwelcome appearance after vanishing from the KSF aquarium as a result of a Chemiclean treatment 6 months prior. The cyanobacteria built up to a significant coating on the sand bed and rockwork by the time the second EtOH addition experiment ended at the 30-day mark. In addition, four larger and relatively old Acropora coral colonies developed white "dead" spots near their bases that gradually spread upward, eventually consuming the corals. It is not possible to establish whether causality or coincidence is at work here. However, the bacteria level at the t = 0 starting point for the second EtOH dosing regimen, ~ 190K bacteria/mL, is significantly higher that the steady-state bacteria populations in the KSF tank measured over the preceding 9 months (~ 70 - 100k bacteria/mL). Water blank controls and examination of a water sample from the PSU HUB tank (see Table 1) ascertained that the now repaired Coulter XL cytometer was still giving reliable readings. It is possible that the now higher bacteria/mL starting point reflects the presence of lots of cyanobacteria in the water column, absent in all of the earlier readings. After the 30-day EtOH dosing experiment of Fig. 16 ended, the KSF tank was treated with Chemiclean as per label directions to remove the cyanobacteria, and then a 90% water replacement (five 60-gallon (34%) water changes conducted over 48 hrs) was performed. Ten days after the completion of this water replacement, the bacteria count of the KSF tank registered at 97000 ± 3000 bacteria/mL, just about where it was prior to the EtOH dosing campaign. The affected corals, unfortunately, did not recover, but frags clipped from the living branches subsequently did thrive. Nevertheless, even given the elevated starting bacteria count, it is clear that the measurable bacteria population in the water column of the KSF 175 gallon aquarium did not undergo the rapid increase upon EtOH dosing that was observed with the removed 30-gallon water samples, Figs. 10 and 11. In addition, there was no detectable trend in [NO3] levels; the value hovered around the 2-5 ppm level throughput. The bacteria population observation is a reminder that the detected bacteria/mL count really reflects a dynamic equilibrium between bacteria introduction (primarily via growth) and bacteria removal by death/predation. In the case of the 30-gallon water samples removed from the tank and placed in a Rubbermaid tub, it seems reasonable to posit that since the sedentary filter feeders (= direct bacteria consumers, or consumers of organisms that consume bacteria; i.e., the "predators") were no longer present, the observed bacteria population increased dramatically upon addition of a fuel source. With the 175 gallon reef tank of Fig. 16, however, the bacteria consumers are still present, and in fact may respond to an EtOH-fueled bacteria population increase by increasing their own numbers as well. The most immediate bacteria consumers, the larger microfauna in the water column, may therefore experience an increase in population also, although our water examination method would not have picked up this increase. Eventually, this carbon fuel (= EtOH) may work its way up the food chain until sedentary filter feeders in the tank (corals, sponges, fan worms, etc) consume it, thereby removing it from the water column (but not from the tank!). Thus, we speculate that the bacteria population may not show evidence of an increase upon EtOH dosing, as any increase is counterbalanced by a corresponding increase in removal via predation. Some of these larger water column microfauna will be removed via skimming*, and so the overall plan of nutrient export will be realized. However, some of the introduced carbon nutrient is likely to be retained within the sedentary filter feeding livestock, and hence it will remain within the overall tank ecosystem. Presumably, as long as these end-consumers live and grow as a result of the added carbon nutrients, they pose no immediate risk for contributing to the waste nutrient level of the aquarium. * In unpublished results, examination of skimmate from the KSF 175 gallon aquarium, removed by the H&S 200 skimmer, via high-resolution optical microscopy revealed the presence of many examples of microfauna of the diatom and foraminifera families. It is likely that members of these families, at least within the foraminifera, do account for some bacterial predation. We thank Jamie Kunkle of the Pennsylvania State University Materials Research Lab for providing these photographs. Overall, the major conclusions from these carbon dosing experiments are Addition of a carbon source (EtOH or uncharacterized organic "gunk") to reef tank water removed from a reef environment leads to dramatic increases in the water column bacteria load. Addition of a carbon source (EtOH) to an active reef tank via a recommended schedule does not lead to any measurable increase in water column bacteria load. Fresh 1-day old saltwater prepared in a non-sterile environment has a bacteria load approximately 10x that of skimmed reef tank water. 3.3 Bacteria removal via mechanical filtration - how effective? The third and final research topic under the general heading of modulating bacteria populations in aquarium water focuses on the question of mechanical bacteria export, a necessary requirement for the overarching goal of carbon dosing-based nutrient depletion. We have already seen circumstantial evidence for bacteria removal from the water column by predation, but that process does not remove the bacterium's nutrient content from the closed aquarium system. For that function, some type of mechanical filtration that specifically targets bacteria for removal is required. The carbon dosing hypothesis cites protein skimming as the mechanism for physical removal of bacteria, with their nutrient load, from the aquarium water. Note that skimming, or any type of mechanical filtration, can only remove bacteria that are in the water column; bacterial biofilms on surfaces can only be cleared if they are dislodged and enter the water column. Therefore, we set out to examine the capability of a protein skimmer, in our case the Bubble King mini 160, to scrub authentic aquarium water of its bacterial load. There are reports in the literature (Brambilla, 2008; Suzuki, 2008) that document the ability of foam fractionation (= protein skimming) to clear bacteria from both coastal seawater and also a closed circulation fish rearing system. In the former case (Suzuki, 2008), a coastal seawater sample from a fishing port near Miyazaki Japan was continuously skimmed with a DYI protein skimmer, and the removal of different types of water column bacteria, reported as efficiency of removal (100% = complete removal of bacteria) follows: Enterococci, Vibrio and Salmonella, 55-60%; Fecal coliform, 5%. Thus, it appears that not all types of bacteria respond identically to bubble-based extraction. The latter experiment (Brambilla, 2008) documented that in a closed, recirculating, fish-only system, water column bacteria populations could be reduced from 32-88% by skimming, depending upon the experimental details. We interpreted these two independent sets of results as providing strong precedent for the expectation that we would observe similar behavior when skimming aquarium water. In addition to protein skimming, many aquarists utilize Granular Activated Carbon (GAC) as an active filtration medium to clear TOC from aquarium water, and so we wondered if GAC might also contribute to the mechanical removal of bacteria from aquarium water as well. The question of GAC-based bacterial water remediation was studied by removing 5 gallons of KSF tank water that had been prepared as follows; the KSF tank's H&S 200 skimmer was turned off for 42 hours before water removal, a 17% (30 gallon) water change with IORC saltwater was conducted 24 hours before water removal, and the tank was fed 3.5 hours before water removal. This 5 gallon water sample was placed in a plastic container and, mindful of the rapid growth of the bacteria population in non-sterile plastic containers, this sample was immediately recirculated through a Phosban reactor containing 150 gm of HC2 GAC. Prior to starting the Phosban reactor pump, five 25 mL water samples were removed from the 5-gallon bucket and placed in sterile centrifuge tubes, capped, and set aside. These five tubes serve as a control for bacteria growth; at 30-minute time intervals during the GAC run, 0.5 mL of 37% formaldehyde solution was added to each tube in succession, and these control tubes were immediately frozen pending later analysis. These tubes are not a perfect control, because they do not account for plastic-container-induced bacteria growth, but they do serve as a check against overall contamination. Samples (25 mL, worked up with formaldehyde as described in the General Experimental) were removed periodically from the 5 gallon volume during the course of the GAC run. An entire experimental time period of 120 minutes was chosen to minimize the opportunity for plastic container-fueled bacteria growth, which might mask detection of any GAC-induced depletion. The data are displayed in Fig. 17. Clearly, there is no evidence that supports the notion that GAC filtration can serve as an effective method for bacteria removal from the water column. Rather than going down, the bacteria levels in the water sample rise slightly (~ 1.4x compared to the starting point) and then decline. This behavior is no different from what might be expected if the container's surface organic load fueled some bacteria growth, at least until the carbon source was consumed. The control samples also rose a little (1.3x) over the same 2-hour time period, a reminder that some small bacterial growth is almost unavoidable in standing water samples. Thus, GAC does not seem to be an effect method for removing bacteria from the water column of reef tanks. Figure 17. Bacteria/mL count within a 5 gallon KSF tank water sample that was subjected to filtration with 150 gm of HC2 Granular Activated Carbon in a Phosban reactor. The water sample was removed from the KSF tank 48 hours after the KSF tank skimmer was turned off, 24 hours after a 17% water change, and 3.5 hours after feeding the tank. We next turned our focus to the larger question of skimmer-based bacteria depletion of reef tank water. As in the GAC experiment, we first "prepared" the KSF tank water sample by (a) turning off the tank skimmer and GAC filter for 42 hours prior to water removal, and ( feeding the tank 3.5 hours prior to water removal. In this instance, the usual 30 gallon water sample was removed from the KSF tank and placed in the Rubbermaid tub containing the Bubble King mini 160 protein skimmer; water circulation was provided by two powerheads. Immediately, five 25 mL control water samples were removed and set aside; these control tubes were dosed in sequence with 0.5 mL of 37% formaldehyde solution at 30-minute time intervals during the skimmer run and frozen for later analysis, as described above. The skimmer was turned on, and the riser tube was adjusted in order to keep the foam height within the boundaries recommended by the manufacturer. 25 mL water samples were removed periodically over 120 minutes and worked up as described above. The data resulting from this study are displayed in Fig. 18. Figure 18. Bacteria/mL count within a 30 gallon water sample removed from the KSF tank and subjected to immediate skimming with a Bubble King mini 160 protein skimmer. The water sample was removed from the KSF aquarium ~ 3.5 hours after feeding the tank; the KSF tank's H&S 200 skimmer and GAC filter were off for 42 hours prior to water removal. The Rubbermaid tub was loosely covered with aluminum foil throughout the experiment. Inspection of these data reveal that, like the GAC experiment, there is no evidence which suggests that this skimmer was able to remove bacteria from this water sample over the 2-hour time period of the experiment. Both the skimmed water samples (pink) and the control samples (aqua) fluctuate in their bacteria/mL values over a fairly narrow range (75 - 90K/mL) without any meaningful trend emerging. Since the skimmed water sample exhibited the same behavior as the unskimmed control water samples, it is not possible to draw any further conclusions from this experiment. These results were quite unsettling; why wasn't the skimmer stripping the aquarium water of at least some of its bacterial load? Is the problem with the skimmer, or is the problem with the bacteria? One approach to probing this puzzling point is to use aquarium water that had been "artificially" spiked with bacteria; perhaps with a much greater bacterial load, the skimmer will function as desired. Towards this end, we took advantage of the previous observation that allowing aquarium water to sit in a plastic container of several days leads to a dramatic increase in the water's bacteria population. We removed a 30 gallon sample of KSF tank water, prepared as described previously, and placed it in the uncovered Rubbermaid tub with the skimmer present but off, and the two powerheads on for circulation. After 5 days, the tub was covered with foil, the skimmer was turned on, and the skimmer experiment was run for 120 minutes. In addition, the usual control samples were removed at the beginning of the skimmer run. In this instance, the water's bacteria population had built up to approximately 7000K/mL, much higher than the 75K/mL starting point of the experiment described in Fig. 18. The results of this "doped" water run are given in Fig. 19. Figure 19. Bacteria/mL count within a 30 gallon water sample removed from the KSF tank and held in a Rubbermaid tub for five days prior to being subjected to skimming with a Bubble King mini 160 protein skimmer. The water sample was removed from the KSF aquarium ~ 3.5 hours after feeding the tank; the KSF tank's H&S 200 skimmer and GAC filter were off for 42 hours prior to water removal. The water sample in the Rubbermaid tub was exposed to fluorescent room lighting for the 5-day settling period, but loosely covered with aluminum foil throughout the skimmer run. This experiment does demonstrate that the Bubble King mini 160 skimmer is effective at removing bacteria from the modified aquarium water sample, at least to the extent of approximately 39% over 2 hours. The control water samples remained fairly constant in comparison. Thus, for the first time, we can conclude that skimming does clear some bacteria from the water column of a reef tank. However, the artificial nature of this experiment, with its induced high bacteria population, raises the important question of its relevance to bacteria removal from an untreated reef tank water sample. Nevertheless, the bubble-based mechanism of protein skimming itself is demonstrated to be capable of bacteria export, and so that component of the Fig. 18 puzzle is exonerated. How can we design an experiment that probes the question of skimmer-based bacterial export in a more realistic reef tank-like setting? One possibility is to rely on our EtOH dosing regimen to provide the necessary "bacteria-rich" but otherwise realistic aquarium water sample. This idea was pursued by removing a 30 gallon water sample from the KSF tank, prepared as described above, and placing it in the Rubbermaid tub with circulation provided by two powerheads. The Bubble King skimmer was in the water, but not running. EtOH (0.29 mL, ~ 1 ppm of C) was added daily for three days. At the 3-day mark, the skimmer was activated, and water samples were removed and worked up as described previously. In addition, the TOC levels of this water sample were monitored during the 120-minute skimming run. The results are presented in Fig. 20. Figure 20. Bacteria/mL count and TOC levels within a 30 gallon water sample removed from the KSF tank, held in a Rubbermaid tub for three days with daily dosing of 0.29 mL EtOH (~ 1 ppm of C) and then subjected to skimming with a Bubble King mini 160 protein skimmer. The water sample was removed from the KSF aquarium ~ 3.5 hours after feeding the tank; the KSF tank's H&S 200 skimmer and GAC filter were off for 42 hours prior to water removal. The water sample in the Rubbermaid tub was exposed to fluorescent room lighting for the 3-day EtOH dosing period, but loosely covered with aluminum foil throughout the skimmer run. The starting bacteria population in this instance, ~ 2300K/mL, was lower than that generated by simply using the tub itself (or its organic surface coating) as a source of bacterial growth nutrients (cf. Fig. 19). The reason for this difference is not clear. Nevertheless, the bacteria depletion profile generated in this experiment (pink line in Fig. 20) is quite similar to that one observed in the experiment of Fig. 19, although the overall % decrease in bacteria population is a little less (28%, vs. 39% in Fig. 19). The non-skimmed control water sample remained relatively constant in its bacteria population over the 2-hour course of this experiment. The TOC level in the water sample is depleted by skimming as well, dropping from about 2.5 ppm down to about 2.0 ppm (~ 25% decrease) over the 2-hour skimmer run. Both the bacteria population and the TOC level appear to have reached their "floors"; no further removal of each was detected over the last third of the run. Once again, we have confirmed that if the aquarium water sample is "spiked" with bacteria, skimmer-based removal is observed. However, the results of both of these experiments (Figs. 19 and 20) indicate that only a component of the entire water column bacteria cohort appears to be susceptible to skimmer-based removal. One last attempt to detect skimmer-based removal of bacteria from KSF aquarium water that is not too perturbed was pursued, Fig. 21. The observation (Fig. 14) that IORC water-change water introduces some bacteria into the aquarium served as the catalyst for this last skimmer run. In this instance, the H&S skimmer and GAC filter were turned off 48 hours prior to water removal. Then, two 30-gallon water changes were conducted on two successive days just before the experimental water sample was removed. Thus, the aquarium water's bacteria population should have been elevated relative to its equilibrium (and unskimmable) levels, but not to an artificially high value like those that attended either the EtOH dosing run (Fig. 20) or the tub contamination run (Fig. 19). This water sample was skimmed immediately upon transfer into the Rubbermaid tub. As it turned out, the initial bacteria population level was not particularly high, around 90K/mL. Over the first 10 minutes of skimmer operation, this value increased to about 100K/mL, presumably as a consequence of added bacteria from the tub/skimmer/powerhead setup. Despite this initial surprising data point, the remaining data set taken over the next 110 minutes followed the expected course, and the bacteria level depleted overall by about 29%. The unskimmed control water sample did not show any notable fluctuations in its bacteria content over the course of the experiment. For the first time, we have obtained evidence that protein skimming will deplete some bacteria from authentic aquarium water that has bacteria/mL levels not so far out of line from an unperturbed system (cf. Table 1). Nevertheless, one message comes through clearly from all of these experiments, regardless of the starting bacteria/mL level; only a minor fraction (~ 28 - 39%) of the bacteria present are susceptible to extraction by bubbles. Figure 21. Bacteria/mL count within a 30 gallon water sample removed from the KSF tank and subjected to skimming with a Bubble King mini 160 protein skimmer. The KSF tank was subjected to two 30-gallon water changes using IORC saltwater (6-days sitting in the water container and 1-day sitting in the water container) on the two successive days prior to water sample removal. The water sample was removed from the KSF aquarium ~ 3.5 hours after feeding the tank; the KSF tank's H&S 200 skimmer and GAC filter were off for 48 hours prior to water removal. The water sample in the Rubbermaid tub was loosely covered with aluminum foil throughout the skimmer run. Finally, we wondered how the skimming results with these "captured" water samples, i.e., samples removed from an authentic reef setting and thus lacking all of the dynamic bacteria growth/removal mechanisms present in a reef tank, might compare to the results obtained upon skimming an actual functioning reef tank. Of course, such a tank cannot be pre-skimmed or we will be back to where we started with Fig. 18. The SJ 55 gallon tank fits this requirement (see Fig. 6); it has a healthy, thriving population of fish, soft corals, invertebrates, etc., but this tank has not been skimmed or treated with GAC filtration for approximately six months. It has, however, been subjected to daily vodka additions as described in the discussion of Table 1 and Fig. 9. The Bubble King mini 160 protein skimmer was placed in the sump of this aquarium system, turned on, and adjusted as described above. Water samples (25 mL) were removed periodically over 24 hours, dosed with 0.5 mL of 37% formaldehyde, and frozen for later analysis. No control samples were utilized in this experiment. The results are depicted in Fig 22. Figure 22. Bacteria/mL count within the water column of a 55 gallon thriving reef tank upon skimming with a Bubble King mini 160 protein skimmer. This tank has been treated with EtOH daily for 6 months but it does not employ either a skimmer or a GAC filter. Clearly, the Bubble King skimmer has performed effectively in dropping the bacteria load of this naturally bacteria-rich tank water by approximately 37%. In fact, this decrease was recorded by the 8-hour mark, and even after 2 hours (the time period of the KSF tank water skimming experiments), the bacteria population decrease was significant; ~ 22%. It should be noted that no late rise in the bacteria population was seen; the skimmer was effective at keeping the level at some baseline value (~ 1500K/mL) for this tank. Interestingly, even thought the bacteria population starting points in the KSF tank water skimming experiments (Figs. 19, 20, and 21) and the SJ 55 skimming experiment were very different, in all cases, only about 28-39% of the original bacteria were removed before the data "flatlined". It is likely a significant observation that there is a floor in aquarium water bacteria populations that skimming will not breach. Perhaps in both water sources, the SJ 55 naïve tank water and the KSF modified (or not) tank water, there appears to be two functionally distinct populations of bacteria; one that is susceptible to bubble-based removal, and one that is not. What is this functional difference, as far as the skimmer is concerned? An earlier publication describes the limitations of bubble-based mechanisms in scrubbing TOC from aquarium water (Feldman, 2009). The argument forwarded in that case may very well apply here as well, Fig. 23. It is plausible that the requirement for hydrophobic patches on particles (i.e., bacteria, TOC molecules or clusters; refer to Bacterial Surface Charge and Protein Skimming, Section 1.2 above) that must be met for successful bubble-based extraction may only apply to some but not all of the aquarium water column bacteria (approximately 28-39%, by our studies). Thus, there may be some discrimination by the skimmer based upon bacteria surface properties. In addition, some but not all bacteria form multicellular clumps (flocs) that may be susceptible to foam-based extraction based upon simple buoyancy and not bubble-surface chemistry; once again, this physical process constitutes a basis for selecting between different bacteria types. So, the bottom line appears to be that some but not all bacteria can be removed by protein skimming. Figure 23. Speculation on why only some but not all of the bacteria present in reef aquaria water is removed by protein skimming (adapted from Feldman, 2009). Overall, the major conclusions from these water column bacteria removal experiments are GAC (Granular Activated Carbon) filtration does not remove bacteria from the water column. Protein skimming (bubbles) removes approximately 30 - 40% of the bacteria in the water column of carbon-treated or organic rich water, but the remainder is not susceptible to bubble-based removal. Steady state bacteria populations in skimmed reef tank water are not subject to further skimmer-based bacteria removal - there is a baseline value that the skimmer will not go below. 4. Conclusions The preliminary studies described herein document, for the first time, the modulation of water column bacteria population in reef tank water as a consequence of either (a) carbon source addition or ( mechanical filtration (GAC, skimming). This information bears on the Carbon Dosing hypothesis for nutrient removal in marine aquaria. Aquaria subjected to active filtration via skimming present water column bacteria populations that are approximately 1/10 of those observed on natural reefs. The consequences of this disparity on the long-term health of the tank's livestock are not known. How do reef tank organisms adapt to such a bacteria-deficient environment? Is the whole food web in an aquarium perturbed, or are there compensatory mechanisms that maintain an appropriate energy transduction through all of the trophic levels? Is "old tank syndrome" related to possible nutritional deficiencies stemming from this bacteria "gap"? Alternatively, could "old tank syndrome" be symptomatic of a gradual decrease of bacterial diversity as a consequence of selective skimmer-based removal of only bubble-susceptible bacteria? At present, it is not possible to go beyond speculation on these points - further research is needed. On the other hand, our studies have shown that bacterial growth appears to be carbon limited in reef aquarium water. However, there is a demonstrable difference between reef tank water in an active reef tank, and reef tank water removed from the tank. In the latter case, bacteria consumers are largely absent, and so fueling bacteria growth via carbon addition translates to rapid and large increases in bacteria population. In an active reef tank, however, this population increase is not manifest, presumably because active predation keeps the overall level in check. Thus, the highly dynamic nature of bacteria populations in the water column of reef aquaria is highlighted by these studies. From a different perspective, the bacteria population in a reef tank seems to act as a buffer to help dissipate the otherwise potentially serious negative consequences of (inadvertent?) tank pollution via rapid carbon addition, at least perhaps up to a saturation point. Finally, mechanical filtration in the form of skimming but not GAC does provide an effective means of bacteria export, at least up to a point. It appears likely that some types of bacteria are indeed "skimmable", but others are not. Thus, skimming inadvertently provides severe (?) evolutionary pressure to skew the tank's resident water column bacteria population to favor the "non-skimmable" cohort. The bottom line with respect to the carbon dosing hypothesis is clear; the basic tenets of this theory appear to hold up to experimental scrutiny; carbon dosing does increase water column bacteria populations, and skimming does remove some bacteria with their attendant nutrient loads. Thus, the underlying science behind this approach to nutrient export appears valid. 5. Acknowledgments We thank the Eberly College of Science at the Pennsylvania State University and E. I DuPont de Nemours and Co. for financial support. The expertise and assistance of Dr. Elaine Kunze, Susan Magaree, and Nicole Zembower of the Flow Cytometry laboratory within the Huck Institutes of the Life Sciences at Penn State is gratefully acknowledged. Furthermore, we thank Mr. David Jones of the Pennsylvania State University Department of Civil and Environmental Engineering for assistance with the Shimadzu 5000 TOC Analyzer. 6. References Ainsworth, T.D.; Fine, M.; Roff, G.; Hoegh-Guldberg, O. 2008. "Bacteria are Not the Primary Cause of Bleaching in the Mediterranean Coral Oculina patagonia." ISME J. (Multidisciplinary Journal of Microbial Ecology), 2, 67-73. Azam, F.; Malfatti, F. 2007. "Microbial Structuring of Marine Ecosystems." Nature Rev. Microbiol., 5, 782-791. Bergey, D.H. 1994. Bergey's Manual of Determinative Bacteriology, 9th ed. (Edited by John G. Holt et al.) Baltimore: Williams & Wilkins. Brambilla, F.; Antonini, M.; Ceccuzzi, P.; Terova, G.; Saroglia, M. 2008. "Foam Fractionation Efficiency in Particulate Matter and Heterotrophic Bacteria Removal from a Recirculating Seabass (Dicentrarchus labrax) System." Aquacultural Engineering, 39, 37-42. Brettar, I.; Rheinheimer, G. 1992. "Influence of Carbon Availability on Denitrification in the Central Baltic Sea." Limnol. Oceanogr., 37, 1146-1163. Bretz, H.W.; Wang S.L.; Grieves, R.B. 1966. "Variables Affecting the Foam Separation of Escherichia coli." Appl. Microbiol., 14, 778-783. Button, D. K.; Robertson, B. R. 1989. "Kinetics of Bacterial Process in Natural Aquatic Systems Based on Biomass as Determined by High-Resolution Flow Cytometry." Cytometry, 10, 558-563. Cano, R.J.; Borucki, M., 1995. "Revival and Identification of Bacterial Spores in 25 to 40 million year old Dominican Amber." Science, 268, 1060-1064. Carlson, C.A.; Ducklow, H.W. 1996. "Growth of Bacterioplankton and Consumption of Dissolved Organic Carbon in the Sargasso Sea." Aq. Microbial Ecol., 10, 69-85. Carrero-Colon, M.; Nakatsu, C.H.; Konopka, A. 2006. "Effect of Nutrient Periodicity on Microbial Community Dynamics." Appl. Environ. Microbiol. 72, 3175-3185. Dinsdale, E. A.; Pantos, O.; Smriga, S.; Edwards, R. A.; Angly, F.; Wegley, L.; Hatay, M.; Hall, D.; Brown, E.; Haynes, M.; Krause, L.; Sala, E.; Sandin, S. A.; Thurber, R. V.; Willis, B. L.; Azam, F.; Knowlton, N.; Rohwer, F. 2008. "Microbial Ecology of Four Coral Atolls in the Northern Line Islands." PLoS One, 3, e1584, 1-17. Ducklow, H. W.; Mitchell, R. 1979. "Bacterial Populations and Adaptations in the Mucus Layers on Living Corals." Limnol. Oceanogr., 24, 715-725. Ducklow, H. W. 1983. "Production and Fate of Bacteria in the Oceans." BioScience, 33, 494-501. Eppley, R. W. 1980. "Estimating Phytoplankton Growth Rates in the Central Oligotrophic Oceans." Brookhaven Symp. Biol., 31, 231-242. Feldman, K. S.; Maers, K. M. 2008. "Total Organic Carbon (TOC) and the Reef Aquarium: an Initial Survey. Part 2." Advanced Aquarist, http://www.advancedaquarist.com/2008/9/aafeature2/ Feldman, K. S.; Maers, K. M. 2008. "Total Organic Carbon (TOC) and the Reef Aquarium: an Initial Survey. Part 1." Advanced Aquarist, http://www.advancedaquarist.com/2008/8/aafeature3/ Feldman, K. S.; Maers, K. M.; Vernese, L. F.; Huber, E. A.; Test, M. R. 2009. "The Development of a Method for the Quantitative Evaluation of Protein Skimmer Performance." Advanced Aquarist. http://www.advancedaquarist.com/2009/1/aafeature2/ Feldman, K. S.; Maers, K. M. 2010. Further Studies on Protein Skimmer Performance." Advanced Aquarist. http://www.advancedaquarist.com/2010/1/aafeature Gaudin, A.M.; Mular, A.L.; O'Connor R.F. 1960. "Separation of Microorganisms by Flotation. I. Development and Evaluation of Assay Procedures." Appl. Microbiol. 8, 84-90. Gaudin, A.M.; Mular, A.L.; O'Connor R.F. 1960. "Separation of Microorganisms by Flotation. II. Flotation of Spores of Bacillus subtilis var. niger." Appl. Microbiol. 8, 91-97. Gaudin, A.M.; Davis, N.S.; Bangs, S.E. 1962. "Flotation of Escherichia coli with Sodium Chloride." Biotech. Bioeng. 4, 211-222. Goldman, J.C.; Dennett, M.R. 2000. "Growth of Marine Bacteria in Batch and Continuous Culture under Carbon and Nitrogen Limitation." Limnol. Oceanogr., 45, 789 - 800. Gottfried, M.; Roman, M. R. 1983. "Ingestion and Incorporation of Coral Mucus Detritus by Reef Zooplankton." Mar. Biol., 72, 211-218. Granger, J.; Price, N.M. 1999. "The Importance of Siderophores in Iron Nutrition of Heterotrophic Marine Bacteria." Limnol. Oceanogr., 44, 541-555. Grégori, G.; Citterio, S,; Ghiani, A.; Labra, M.; Sgorbati, S.; Brown, S.; Denis, M. 2001. "Resolution of Viable and Membrane-Compromised Bacteria in Freshwater and Marine Waters Based on Analytical Flow Cytometry and Nucleic Acid Double Staining." Appl. Environ. Microbiol., 67, 4662-4670. Gruber, D.F.; Simjouw, J.-P.; Seitzinger, S. P.; Taghon, G.L., 2006. "Dynamics and Characterization of Refractory Dissolved Organic Matter Produced by a Pure Bacterial Culture in an Experimental Predator-Prey System." Appl. Environ. Microbiol. 72, 4184-4191. Hobbie, J.E.; Daley, R. J.; Jasper, S. 1977. "Use of Nucleopore Filters for Counting Bacteria by Epifluorescence Microscopy. Appl. Environ. Microbiol. 33, 1225-1228. Johannes, R. E. 1967. "Ecology of Organic Aggregates in the Vicinity of a Coral Reef." Limnol. Oceanogr., 12, 189-195. Lebaron, P.; Parthuisot, N.; Catala, P. 1998. "Comparison of Blue Nucleic Acid Dyes for Flow Cytometric Enumeration of Bacteria in Aquatic Systems." Appl. Environ. Microbiol., 64, 1725-1730. Kirchman, D.L. 1994. "The Uptake of Inorganic Nutrients by Heterotrophic Bacteria." Microbial Ecology, 28, 255-271. Konhauser, K. 2007. Introduction to Geomicrobiology. Massachusetts: Blackwell Publishing. Kooperman, N.; Ben-Dov, E.; Kramarsky-Winter, E.; Barak, Z.; Kushmaro, A. 2007. "Coral mucus-associated bacterial communities from natural and aquarium environments." FEMS Microbiol Lett, 276, 106-113. Kvennefors, E.C.E.; Sampayo, E.; Ridgway, T.; Barnes, A.C.; Hoegh-Guldberg, O. 2010. "Bacterial Communities of Two Ubiquitous Great Barrier Reef Corals Reveals both Site- and Species-Specificity of Common Bacterial Associates." PLoS One, 5, e10401. MacLeod, R.A. 1965. "The Question of the Existence of Specific Marine Bacteria." Bacteriol. Rev., 29, 9-23. Marie, D.; Partensky, F.; Jacquet, S.; Vaulot, D. 1997. "Enumeration and Cell Cycle Analysis of Natural Populations of Marine Picoplankton by Flow Cytometry Using the Nucleic Acid Stain SYBR Green 1." Appl. Environ. Microbiol., 63, 186-193. Marie, D.; Partensky, F.; Vaulot, D.; Brussaard, C. 1999. "Enumeration of Phytoplankton, Bacteria, and Viruses in Marine Samples." Curr. Prot. Cytometry, 11.11.1-11.11.15. Michael, E. 2008. http://glassbox-design.com/2008/achieved-through-observation-and-experimentation/. Monfort, P.; Baleux, B. 1992. "Comparison of Flow Cytometry and Epifluorescence Microscopy for Counting Bacteria in Aquatic Ecosystems." Cytometry, 13, 188-192. Monger, B. C.; Landry, M. R. 1993. "Flow Cytometric Analysis of Marine Bacteria with Hoechst 33342." Appl. Environ. Microbiol., 59, 905-911. Moriarty, D. J. W.; Pollard, P. C.; Hunt, W. G. 1985. "Temporal and Spatial Variation in Bacterial Production in the Water Column over a Coral Reef." Mar. Biol., 85, 285-292. Noble, R. T.; Fuhrman, J. A. 1998. Use of SYBR Green 1 for Rapid Epifluorescence Counts of Marine Viruses and Bacteria." Aquat. Microb. Ecol., 14, 113-118. Paul, J. H.; Rose, J. B.; Jiang, S. C.; Kellogg, C. A.; Dickson, L. 1993. "Distribution of Viral Abundance in the Reef Environment of Key Largo, Florida." Environ. Microbiol., 59, 718-724. Porter, J. 2004. "Flow Cytometry and Environmental Microbiology." Curr. Protocols Cytometry, 11.2.1-11.2.13. Rivkin, R.B.; Anderson, M.R. 1997. "Inorganic Nutrient Limitation of Oceanic Bacterioplankton." Limnol. Oceanogr., 42, 730-740. Robertson, B. R.; Button, D. K. 1989. "Characterizing Aquatic Bacteria According to Population, Cell Size, and Apparent DNA Content by Flow Cytometry." Cytometry, 10, 70-76. Rypien, K.L.; Ward, J.R.; Azam, F., 2010. "Antagonistic Interactions Among Coral-Associated Bacteria." Environ Microbial., 12, 28-39. Suzuki, Y.; Hanagasaki, N.; Furukawa, T.; Yoshida, T. 2008. "Removal of Bacteria from Coastal Seawater by Foam Separation Using Dispersed Bubbles and Surface-Active Substances." J. Biosci. Bioeng., 105, 383-388. Thompson, J.; MacLeod, R.A. 1974. "Potassium Transport and the Relationship between Intracellular Potassium Concentration and Amino Acid Uptake by Cells of a Marine Pseudomonad." J. Bacteriology, 120, 598-603. Todar, K. 2008. Todar's Online Textbook of Bacteriology. http://www.textbookofbacteriology.net/index.html . Troussellier, M.; Courties, C.; Vaquer, A. 1993. "Recent Applications of Flow Cytometry in Aquatic Microbial Ecology." Biol. Cell, 78, 111-121. Troussellier, M.; Courties, C.; Zettelmaier, S. 1995. "Flow Cytometric Analysis of Coastal Lagoon Bacterioplankton and Picoplankton: Fixation and Storage Effects." Estuar. Coast. Shelf Sci., 40, 621-633. Verschuere, L.; Rombaut, G.; Sorgeloos, P.; Verstraete, W. 2000. "Probiotic Bacteria as Biological Control Agents in Aquaculture." Microbiol. Molec. Biol. Rev., 64, 655-671. Walton, N. A.; Bjornson, M. 2008. "Vodka Dosing…Distilled! A Powerful Method for the Reduction of Nitrates and Phosphates within the Reef Aquaria." ReefKeeping, 8. http://reefkeeping.com/issues/2008-08/nftt/index.php Wegley, L.; Mosier-Boss, P.; Lieberman, S.; Andrews, J.; Graff-Baker, A.; Rohwer, F. 2006. Environ. Microbiol., 8, 1775-1782. Yoshinaga, I.; Fukami, K.; Ishida, Y. 1991. "Comparison of DNA and Protein Synthesis Rates of Bacterial Assemblages Between Coral Reef Waters and Pelagic Waters in Tropical Ocean." Marine Ecol. Prog. Ser., 76, 167-174. View the full article
-
Click through to see the images. My system consists of over 700 gallons including a 240 gallon display tank, a 300 gallon Agway livestock trough as a sump, and a 180 gallon frag tank. I have over 2000 watts of light including four 400 watt Radium bulbs, four 110 watt VHOs,and four newly added 30 watt blue LED strips. I believe in using the Berlin System and don't like additives or fancy equipment although I do have a skimmer, a kalkwasser stirrer, and a calcium reactor. The latter I have because my corals consume an enormous amount of calcium and alkalinity which kalkwasser alone can not keep up with. I run the metal halides for 10 hours, the VHOs for 14 and the LEDs for 16, and I keep my tank at precisely 79 to 80 degrees F with a Ranco controller and a small fan. So there you have my tank in a nut shell, and a synopsis of what is most common in tank articles. Now let's talk about the good stuff. How exactly did I become an advanced aquarist and how can you become one too . . . now that's an interesting story. Editor's Note: There's more photos of Joe's awesome 240 gallon tank in his this month's Feature Aquarium Photo Album. Beware the Salesman In the fall of 2001, I walked into one of the local fish stores and was immediately struck with the "bug". Being a typical American male who is only satisfied with instant gratification I ended up walking out of the store with a 7 gallon bowfront tank, 2 clown fish, a heteractis magnifica, and an assurance from the proprietor that all would be well as long as I kept changing the water weekly. Obviously that was a disaster; so, on to another LFS and an upgrade to a 50 gallon tank with water, live rock, and live sand taken from the shops reef system so I could avoid that pesky cycle. Sadly the 3 hippo tangs, 1 damsel and the still living two clowns could tell you that the cycle was terrible with ich killing 2 of the 3 hippos. Finally after 2 dead fish and a dead anemone, I ran into Chris Jessen who was the owner of Reef & Fin in Stamford, CT. I knew I had found the right spot when I asked to use the stores restroom and found a paper target with the name of the first local fish shop I had visited printed on it at the base of the urinal. The difficulty was I continued to hear conflicting information. I would go online and read about the latest skimmer, lamp, or vodka dosing scheme and go to Chris convinced that I had to have "the thing" to make my system successful. He, of course, would laugh and reach into his vast encyclopedia of knowledge and explain how he had already tried such and such years ago and I didn't really need it, but if I had to have it, he'd be more than happy to sell it to me. Over the years, I went through this process again and again. At one point I was conversing online with a well known marine biologist who had me convinced that the spectrum of my lighting could never effect the color of my corals, and at the same time a second well known name tried to impress upon me the critical importance of using a deep sand bed never mind that neither of them had reefs of their own they were the voices of authority and I was loath to ignore their advice. Then, quite suddenly, my first aquarium epiphany hit. If someone has a tank and coral I like, all I need to do is copy their system, and my success should be guaranteed. Hah, if only it could be so easy! Copy the Good - Find Your Inspiration The first system I tried to copy was Chris Jessen's show tank. It didn't matter that he had a retail operation, if he had a 300 gallon sump then by gosh I needed a 300 gallon sump as well. The 280 gallon display tank I created simply by copying everything Chris did came out fantastically and gave me a chance to gain enormous experience in keeping many different corals, but I was always struggling to keep it pest free and to get color on the corals placed in the lower zones. After a year or so I had the unbelievable luck to visit Steve Weast's home in Oregon and got to see what a home reef could look like in the hands of a truly advanced aquarist. After leaving his home and making a brief stop at ReefStuff.com to visit another "old salt" Rick Souta also in Oregon, I left with a new found dedication and a plan for the future. I knew I couldn't duplicate Steve's OCD fanaticism for cleanliness, but I also realized if Rick and Steve could grow colorful corals year after year without any special equipment or gimmicks then so could I especially if I used homegrown frags of proven heritage. They had tanks full of nothing but colorful corals of amazing size that they had grown from tiny frags over many years and the only thing I could see different from what they were doing and what I was doing was their maintenance regimem and their reliance on a combination of 20000k lamps and 10000k lamps in the same hood. Not too long after visiting Oregon, I saw my first open top system online. Instantly the benefits were clear to me. The ability to reach and touch any part of the tank at any time meant I could fix any problem that arose quickly and easily. My strategy changed from simple emulation to one of active design. I became determined to create something new and better. Design with a Purpose When I sat down to design my current system I spent considerable time trying to think about what it is I want from this hobby. That's when I realized that for me reef keeping was akin to gardening. I love colorful acroporas, seriatoporas, and stylophoras. The challenge of learning to grow and keep healthy corals was my driving force, fish and soft corals were but secondary fillers. I began to think of my next tank as similar to learning to grow a bonsai or an orchid. I had a picture of what I wanted it to look like and now all I needed was the skill set to grow the corals in just that way. By relying on corals I had and coral frags grown in others tanks, I would know what colors and forms were possible and therefore I would have a steady barometer upon which to measure my success. If a coral failed to achieve its color potential or took on a strange form I could be certain I was treating it wrong, and in keeping with that same philosophy I wanted space for the corals to grow as big as they might in nature which meant that I would have to restrict my coral selection to a chosen few. Gone would be the days of collecting specimens for the sake of collecting, but then again that fit nicely with my growing sense of conservation. With the areas of coral collection being restricted more and more world wide, I was proud that my new tank would be dedicated to growing captive raised stock. So you can see, everything about my new design was for the benefit of my corals. Beginning with the tank itself. It's All About the Tank My biggest problem up to that time was the difficulty I had in working on my display. The 280 I had was acrylic and had 3 small cutouts on the top. The stand brought the front glass up to a height for ideal viewing while you were standing. In order to work on the tank I needed a ladder, and I had to either remove the 72 inch fixture from the hood or contort myself under it. For really big work, I needed another strong person to lift the 100 lb cabinet off the top. It looked great and made for a nice piece of furniture, but it severely hampered my hands on maintenance. My new tank would be the complete opposite. The stand would be low enough to allow access with no ladder. The glass was thick enough so there would be no braces on top to distort light or hinder adding and removing rocks or corals. The tank was limited to 24 inches in height to allow a normal arms reach from top to bottom. Everything about the layout was intended to make working on every inch of the tank easy. The only limitation I saw was that one would have to sit to optimally view the tank, and any fish that had a tendency to jump would not be good for this tank, but since my focus was my corals and not the fish the latter was of little concern, and given my tendency to stare at my tank for hours on end at night sitting was preferable anyways. Lastly, the tank was to be square. This meant I could build two pillars of live rock with a deep channel in between in a small attempt to mimic the basic design of Steve Weast's tank. Also having a square tank meant I could place two light fixtures above the tank, and if I built the pillars just close enough to each other and slightly off the walls I would be able to insure that every coral was receiving light from all sides thus preventing the corals from becoming brown on the sides facing away from the light. In addition, the plan called for a small overflow to maximize the space for aquascaping. I opted to have an internal overflow to keep the tank from extending too far out into the center of the room, and that is the only element of my design that I would change if I were to start over today. The acrylic cover on the overflow is an unnecessary eyesore and the extra space in the tank would be most welcome. In any case the smaller overflow meant that main tank circulation would be low and the primary in tank water movement would come from my Tunzes. A nice aspect of the two pillar design was that the Tunzes could hide behind the rock work and therefore remain hidden when viewing from the front. Regardless of how small the overflow was the open top did bring an added concern of noise, fortunately I was able to use a modified Stockman pipe design to silence the flow. The drain is 1.5 inches but I added a small piece of 2 inch PVC to the 1.5 inch drain pipe and then put another 1.5 inch piece on top of that with a 3 inch cap at the very top and the drain holes inside the cap along the 1.5 inch pipe. I'm not a plumber, and I'm uncertain of the dynamics involved but the drain is absolutely silent even though it's flowing an easy 500 gallons an hour or more. Unfortunately for me and my new plans, my wife was on to the costs associated with this hobby so I was also restricted by a tight budget. I found a discount tank manufacturer that made strong but perhaps ever so slightly imperfect tanks and ordered a new 240 gallon 48 x 48 x 24 tank and stand for only $700. Then borrowing from something I'd seen online I went to home depot and purchased electrical conduit that I bent into an L shape for hanging the lights. The only expensive parts remaining were the light fixtures, but I sold some old equipment and made up for the cost of the two new 48 inch PFO combination VHO and MH light fixtures. Lighting - Hang It Up but Don't Get Hung Up As has been said many times over, by aquarists far more skilled than I, lighting is a personal choice, and one that can overwhelm beginners easily, but for me it was simple. After years of looking at other successful acropora filled tanks the most common combination I saw was 400 watt Radiums and T-12 UVL Super Actinics and that was what I planned on using initially hence my purchase of the PFO hoods which are perfect for such a combination. I still believed (and do today as well) that certain corals benefit from 10000k lighting, particularly reds and pinks, but when I tried to mix 10000k metal halide with the Radiums the differences in color were quite apparent across the tank so instead I opted to run four metal halide Radium lamps, two UVL 110 watt Aquasun lamps, and two UVL Super Actinic lamps this way I felt I had all the bases covered. (Just recently I mounted four 48 inch ReefBrite LED strips to the sides of the fixtures and removed the Super Actinic lamps and replaced them with two additional Aquasun lamps in the hopes that this will enhance the growth of my elusive red stylophora that has been struggling to grow for 3 years.) The ballast choice was also easy as the whitest look only comes from the venerable and now extinct PFO-HQI ballasts. The overdriven lamps clearly get the job done and I was concerned about life expectancy, but so far I have been getting a steady year of service from each lamp and never had any fail on me yet. I have had to replace the capacitor on one of the ballasts, but that has been the only trouble to date. One of the more challenging aspects of establishing the lighting regimen was deciding on the length of day. Initially I read some research that made me suspect, the average aquarium light system was excessively saturating the corals, but when I tried to reduce the photoperiod to eight hours or so the results were dramatic, negative, and rapid so I quickly returned to my previous 10 hours of metal halide lighting. My hope is that the new LED technology will pave the way for a giant reduction in my electric costs, but I'll reserve judgement there until I see a few more examples of established tanks grown exclusively on LEDs as proof. Day One a New Tank The day of the switch all went well and in September of 2007 my new tank was up and running. The hardest part for me was sticking to the plan. When I was done on that first day my tank looked horribly bare. I was desperate to fill it in with new corals, but then I was dedicated to my new plan, and somehow managed to resist the temptation. I even tried to avoid fast growing corals as much as possible. I put the few fast growers I had on separate pieces of rock so I could remove the entire colony if need be when it grew too large, but growing every coral perfectly isn't easy and I still had much to learn. Placing a low light Lokani in a high light location simply won't work. Placing a stylophora in high flow that worked for a humilis didn't work. Over time I got better at placement and now I even go so far as to research the corals natural habitat when possible. My most recent frag purchase was an echinata and thanks to a conversation with a diver in Australia I managed to place it in an area of medium regular flow and low light that seems to suit it perfectly. Because of my focus on corals from other reefers tanks I am keenly aware of how the corals can look both in color and form. So if my lokani isn't purple or my seriatopora isn't brilliant pink something isn't right, and that I think is the secret to a great reef and being an advanced aquarist. When you can look at your tank and see a coral losing color, AND you know you skipped a water change or haven't checked your parameters lately that's when your tank will get to the "next level". This awareness is what forces one into a strict regimen. Maintenance is Everything Gone are the days when I skip a skimmer cleaning or a water test. If one of my corals is pale or my goniopora is retracted I know something is wrong and I take action, but slow action. For example, when I test calcium or magnesium and the results aren't normal, I'll check the results 3 times and even try to find someway to test the test itself before I make a change. Where I used to accept my brine refractometer calibrated at 77 degrees with only RO water now I use a saltwater dedicated refractometer calibrated at precisely 20 degrees C and double checked with a 35 ppt calibration fluid. I have become a water quality fanatic desperate to keep my water as close to an Indonesian reef as possible. I try not to let my calcium stray more than +_ 20 ppm or my alkalinity vary greater than 0.3 meq/L. (Incidentally, the maintaining of proper alkalinity has proven by far the biggest challenge, and I'd love to see some future work as to why that might be.) I change 50 gallons a week religiously, and keep all my pumps in tip top shape with a regular cleaning in vinegar. If my sand looks dirty I clean it with a siphon or a slotted spoon and replace it with new cups of clean sand as needed. Rather than trying to remember when I last changed my bulbs I keep a journal and even write the date of installation on the ends to be sure, but the regimens alone I don't believe are the whole answer. The successful reefs I tried to copy all had heavy bio-loads with a resulting heavy reliance on a healthy Berlin System. To me the recent research showing how little organic waste is removed by skimmers is proof enough of the importance of live rock as a natural waste removing factory. I contemplated trying the much discussed Zeo-vit system at one time, but after a great deal of research I decided that the additives were snake oil and the zeolite was doing nothing more than providing an extremely porous rock upon which bacteria could cultivate and the rinsing action of the zeovit reactor was keeping the bacteria barrier clean and active so instead of zeovit I simply added 200 lbs of live rock in my sump and began rinsing it regularly in old tank water to keep it in good waste eating shape, but even with all that extra care and proper maintenance, I still needed more to make it perfect. Tested Target Parameters Parameter Result Salinity35 ppt (D D Saltwater refractometer 1.0265)Calcium420 ppm (Elos)Alkalinity7 dKH (Salifert)Magnesium1300 ppm (Salifert)pH8.1 (Pinpoint)Temperature79° FItem Equipment UsedHeat/CoolingRanco Controller with dual Jager 250 watt heaters and fanTop OffMaxijet 1200 feeding from 150 gal RO/DI holding tank (70 drips/min)DosersKent Marine gravity feed for B-Ionic 2 part dosingDrainDIY modified StockmanFiltration2 x Marineland Tidepool II sumps with traysKalkwasserDeltec StirrerCalcium ReactorMTC ProCalWavemakerTunze 7094 ControllerPowerheadsTunze Turbelle Stream 6105Main CirculationIwaki 100RLT - half to display; half to frag tank (1000 gals/hr)Skimmer PumpIwaki 100RLTSkimmerMTC HSA 1000Frag Lighting3 x 250 watt Radiums on PFO-HQI ballasts 2 x 60 inch UVL Super Actinic bulbs on an IceCap 660 ballastPrimary Lighting4 x 400 watt Radiums on PFO-HQI ballsts 2 x 48 inch ReefBrite Blue LEDs 4 x 48 inch UVL Aquasun bulbs on an IceCap 660 ballast Frag Tank180 gallon Oceanic tank and standSump300 gallon Agway livestock troughDisplay Tank240 gallon Glasscages tank and stand (48 x 48 x 24)EquipmentItem UsedSand Bed1 inch/ 5 micronSupplemental200 lbs live rock in sumpDisplay200 lbs live rock various varietiesBerlin System ElementsItem UsedSaltCoralifeIodineKent Marine Tech-IAdded Calcium and AlkESV B-Ionic 2 partCalcium HydroxideESV kalkReactor MediaCaribSea ARM coarse mediaMineral SupplementsLight Time400 watt Radiums9AM to 7PM (10 hrs)Aquasun VHOs8AM to 8PM (12 hrs)ReefBrite Blue LEDS6AM to 10PM (16 hrs)Lighting Schedule Hard Corals Acropora Tortuosa (Oregon Tort) Acropora Tortuosa (ORA Tort) Acropora Lokani (30,000 Leagues) Acropora Valida (Tyree Purple Monster) Acropora Abrolhosensis Acropora Gemmifera Acropora Humilis Acropora Millepora Acropora Nana Acropora Plana Acropora Prostrata Acropora Tenuis Acropora Secale AcroporaTuraki Blastomussa Cyphastrea Favia Hydnophora Montipora Capricornis Montipora Digitata Pocillipora Seriatopora Stylophora Turbinaria Soft Corals Palythoa (Purple Death) Ricordea Zoanthids Actinodiscus Gorgonian Goniopora Fish 1 Coral Beauty 1 Kole Tang 1 Royal Gramma 1 South Seas Devil fish 1 Tilefish 1 Yellow Tang 2 Banggai Cardinal 1 Longnose Filefish 2 True Percula 3 Red-Striped Cardinals 3 Yellow Clown Gobies 1 Black Clown Gobie 20 Damsels 13 Bartlett Anthias 2 Lyre Tail Anthias Invertebrates [*]1 Bullseye Pistol Shrimp[*]2 Pinstriped Tuxedo Urchins[*]2 skunk cleaner shrimp[*]5+ emerald crabs[*]10+ Peppermint Shrimp[*]10+ red leg hermits[*]100+ blue leg hermits[*]100+ Turbo snails Maintenance Schedule Daily: clean glass, feed twice (frozen: brine+, mysis, cyclop -eeze, arctic pods, bloodworms, sushi grade fish eggs), check basement, worry about developing algae bloom, top off sump with RO if not right on, check pH monitor for 8.1 and temp for 80, add 200 ml of B-Ionic 2 part if pH is 8.0 or less. Weekly: 50 gallon water change (Coralife salt), clean skimmer, clean teeth on overflow, clean anti-siphon hole in return line, pull and inspect Stockman drain, mix next weeks water, clean and refill Deltec Kalk stirrer, add 100 ml Kent Tech-I iodine, siphon detritus as needed. Monthly: siphon sand bed clean, run 2 trays of carbon or 2 combination carbon/phosphate remover filter pads for 2 days or so to uncloud water, test water for Ca (Elos), Mg (Salifert), pH (Pinpoint), salinity (D-D refractometer), kH (Salifert). Make adjustments as necessary to hit 420 ppm Ca, 1250 ppm Mg, kH 8, pH 8.1, salinity 35 ppt. Quartlery: Take out the 2 Tunzes and replace with clean standbys, then leave the dirty ones to soak in vinegar for a couple days, take out 2 Maxi-jets in frag tank and replace with clean ones then soak old ones in vinegar, remove and clean stockman drain, clean pump intake screens, vacuum sump bottom, rinse live rock in sump with old tank water saved in 40 gallon garbi can, sell frags and make some new frags. 6 Months: change RO/DI carbon block and 0.5 micron pre-filter. 9 Months: Change VHOs and record date on end of tube and in tank journal Annually: Change MHs, exchange 2 main pumps for clean pumps and disassemble and clean old pumps for next year using Muriatic Acid, change RO/DI DI cartridge and RO cartridge, 300 gallon water change (usually associated with some major event like plumbing change or re-aquascape or, heaven forbid, a pest treatment or just a major sump cleanout. When Needed: add sand if bottom shows, run phosphate remover, clean scale off heaters, buy cleanup crew to knock back whatever algae bloom hits Mithrax for valonia, nudibrancs for Briopsys, etc; clean and refill calcium reactor, exchange CO2 bottle, replace RO float shutoff switch, trim corals or even remove whole overgrown colonies (this happens once a year at least and is always a little sad) change Via-Aqua powerhead on bottom of sump (keeps the surface stirred up). There's More to Consider Very quickly I knew that being neat and clean wasn't enough so I tried to consider every element I could. For instance I read an article showing corals absorbed sugar water faster when placed in a wave environment with a cycle that operated between 1 and 3 seconds so now I pulse my Tunzes on their fastest setting. I use two Tunzes on opposite sides of the tank and only run one at a time for a period of six hours so no coral is subject to excessive laminar flow which might cause it's form to become irregular. I considered removing my kalkwasser stirrer, but then I found evidence linking kalk to phosphate removal. I added two small tray filters between the skimmer and the sump for ease of media addition. When the water gets cloudy or the sand forms a red diatom, I can add some carbon or phosphate remover for 48 hours or so and then easily dump it out, but I never leave the media in for extended periods as I fear it can be too effective in removing too much of both good and bad elements. Also the trays allow me to run 0.5 micron filter pads if the water seems to be getting heavy in dusty particulate, and even though I believe skimmers are not as important as originally thought I did increase the skimmer pump from an Iwaki 55 to an Iwaki 100 to insure the greatest bubble production possible. Unfortunately some years back I discovered that my basement is high in CO2 so I drilled a hole to the exterior of the house and ran an air hose from the skimmer air intake to the exterior of the house. Then too I try to keep pairs of fish and shrimp and shoals of fish all in an attempt to create mated pairs that spawn regularly and feed the system indirectly. I always keep a pair of cleaner shrimp in my tank as I find nearly all the fish will visit them on a regular basis so I must assume their is a need for parasite removal just as in nature. As a brief aside I have not had any outbreak of fish disease or parasites since I began the habit of keeping cleaner shrimp. All of which is to say I promote the overall health of each inhabitant in any way I can, and even more importantly I have the patience to stick with a creature even when it looks doomed. When I first purchased my tiny frag of Oregon Tort in 2003 it was a mere 1/2 inch in size, and fell into the sand initially and died half away, but I placed it carefully into a more secure location, gave it plenty of free space, and it grew slowly but steadily into the monster that it is today. My second heteractis magnifica I purchased in the spring of 2002 (for the record I would never advocate purchasing these anemones and will never buy one again; their survival rate is too low)and it started life with me in my 50 gallon tank under 150 watt metal halides. During the first few weeks it climbed around the tank and twice got sucked into a Maxijet powerhead intake screen, and I had to cut away pieces of its pedicle to free it. Eventually I built a tall rock pile as high as I could under the MH lights and topped it off with a perfectly smooth rock and then suddenly the anemone stopped wandering. When I tried to feed it frozen cubes it would take them in then spit them out half dissolved, but I persevered and simply took the half eaten waste out and fed the anemone again. It took years, but today the anemone has split 3 times and has grown in size and stinging ability many times over. The changes came slowly, one might even say glacially and that is where patience and dedication pays off. Clearly good things come to those who wait so if you're just starting out I can't stress enough the importance of patience and dedication. Stick With It - Be Prepared No matter how dedicated you think you are when you start, there comes a time in every reefers mind when they ask themselves if it really is all worth it. For me the worst moment came in August of 2003 while I was on vacation. All of New England experienced a blackout and my house was without power for 48 hours. When the tank sitter finally arrived more than half the tank was dead. Perhaps the bigger miracle is the fact that I didn't lose everything, but there I feel the benefit of the basement sump played a big role. In any case, I was distraught at the loss and ready to throw in the towel. Fortunately my wife gave me the encouragement I needed, and I made sure to never have that problem again by purchasing a generator. Virtually every mistake you can think of has been made so if you are starting out today take the time to learn from other's disasters and prepare yourself for the inevitable. What will you do when the power goes out? How will you handle a main circulation pump that suddenly freezes up? Who will check your tank when you're on vacation? Do you know what to do if you overdose alkalinity and cause a sudden precipitation event? (The answer is do nothing.) Nearly always there will be simple answers whether that be battery operated air bubblers or a neighbors kid, but if you haven't thought about it the frustration you feel when the problem suddenly hits can be debilitating. Plan for the worst and you'll find it easier to handle the unexpected. Because if you quit you'll never reach that dream you had in mind when you started. It's All About Friends In the end though, there is one critical element without which I could never have succeeded: my fellow reefers. Whether it is Dana Riddles articles on light, frags from super aquarist Keith Berkelhammer, or help from Jason Edward of Greenwich Aquaria with routine care and vacation reef sitting, I could never have the tank I do today without all the help. The hard work of our reefing community is unbelievable. The growing availability of homegrown frags and even fish means we should all be able to enjoy this hobby for decades to come. So if you want to be a successful coral gardner too, my advice is find some friends who have already done it, read as much as you can stand before you start, and take your time to do it "right". View the full article
-
normal glass vs crystal glass
Harlequinmania replied to Joeteng's topic in New to the Marine Aquaria Hobby
If you wish to compare between a Acrylic tank vs Glass tank , here are the info; 1. Acrylic is a better insulator than glass so a smaller heater will work for the same sized aquarium and temperature fluctuations happen slower. This is good for stability. 2. Acrylic is clearer than glass. It actually lets 14% more light through than glass. 3. Acrylic can have a much greater variety of shapes. Acrylic aquariums commonly have rounded corners (rather than seams) and usually have a more 'contemporary' look. Acrylic coffee tables and even bubble tanks (like Captain Picard's aquarium on Star Trek). 4. A disadvantage of acrylic is that it scratches much easier (be careful with inside decorations) so special cleaning pads must be used. NEVER use a brillo pad or a green pot scrubber on an acrylic aquarium. 5. Perhaps the biggest disadvantage of acrylic is the cost. Usually an acrylic aquarium will cost 2 to 3 times what a similar sized glass aquarium would. ** Extracted from animal-world.com -
Part 3
-
Part 2
-
Enjoy Part one
-
Multicolor angel, flame wrasse, AT , earspot angel, Emperor spotted in CF.. LCK still have one adult Blue angel, queen angel and some juv blue angel . Saw this fish in CF, anyone can ID this ?